03. The Query Builder
This page describes how the query builder should work.
Name
In the UI, the query builder will be called the Data Explorer to make it more approachable for non-technical users. This should also help convey to users that they can explore their data here, they’re not necessarily doing anything permanent.
Navigating to the Query Builder
- The query builder should be accessible from anywhere in a schema. It should not be tied to a specific table or view.
- The query builder should be able to be pre-populated with a query and linked to.
- For example, if a user tries to set a unique constraint for a column that has non-unique values, we may want to open up the query builder with a pre-populated query that shows all duplicate rows.
Base Table
All queries will start from a single “base table”. This table will determine which columns are available to be added to the output of the View. The user should be able to set the base table at the start of building their query. They might either explicitly set it or we could infer it from the first column they select.
We might also want to show the base table in the query builder UI somehow.
Selecting Columns
Users should be able to add columns to see in the query’s output. Users can add columns in two ways: from a table or from a formula.
From a Table
- The user will see a list of available columns.
- Once the user has added a column, we make a best guess for the following attributes:
- Source Relationship: This is the relationship of the column’s table to the base table.
- If there’s only one way that the tables are related, there is no need to make a guess.
- If there are multiple relationships between the table, we will pick one.
- Aggregation: This sets how the column is aggregated (none i.e. separate rows per unique pair, list, count, average, min, max, etc.).
- This is only applicable to tables which have multiple related records to the base table.
- By default, we will aggregate columns as a list.
- Please see Record Aggregations for a list of all aggregations supported.
- Source Relationship: This is the relationship of the column’s table to the base table.
- The user will see the source relationship and aggregations used and can alter them if desired.
- The user can also alter the column in the following ways:
- Adding a Formula: This alters the column to use a formula where one of the variables is the column.
- Adding a Filter: This filters the column’s results to a subset.
- Once added, the user can also edit formulas and filters.
- The user can delete the column if they choose.
From a Formula
- The user will see a list of available formulas organized by type of formula.
- The user can select a formula. They will then be prompted for the variables to use in that formula.
- The number of variables and the types of data they accept depend on the formula chosen.
- Once they select the variables for the formula, the column is then added.
- The user can edit the formula if they choose.
- The user can also apply a filter to the column and edit a filter once applied.
- The user can delete the column if they choose.
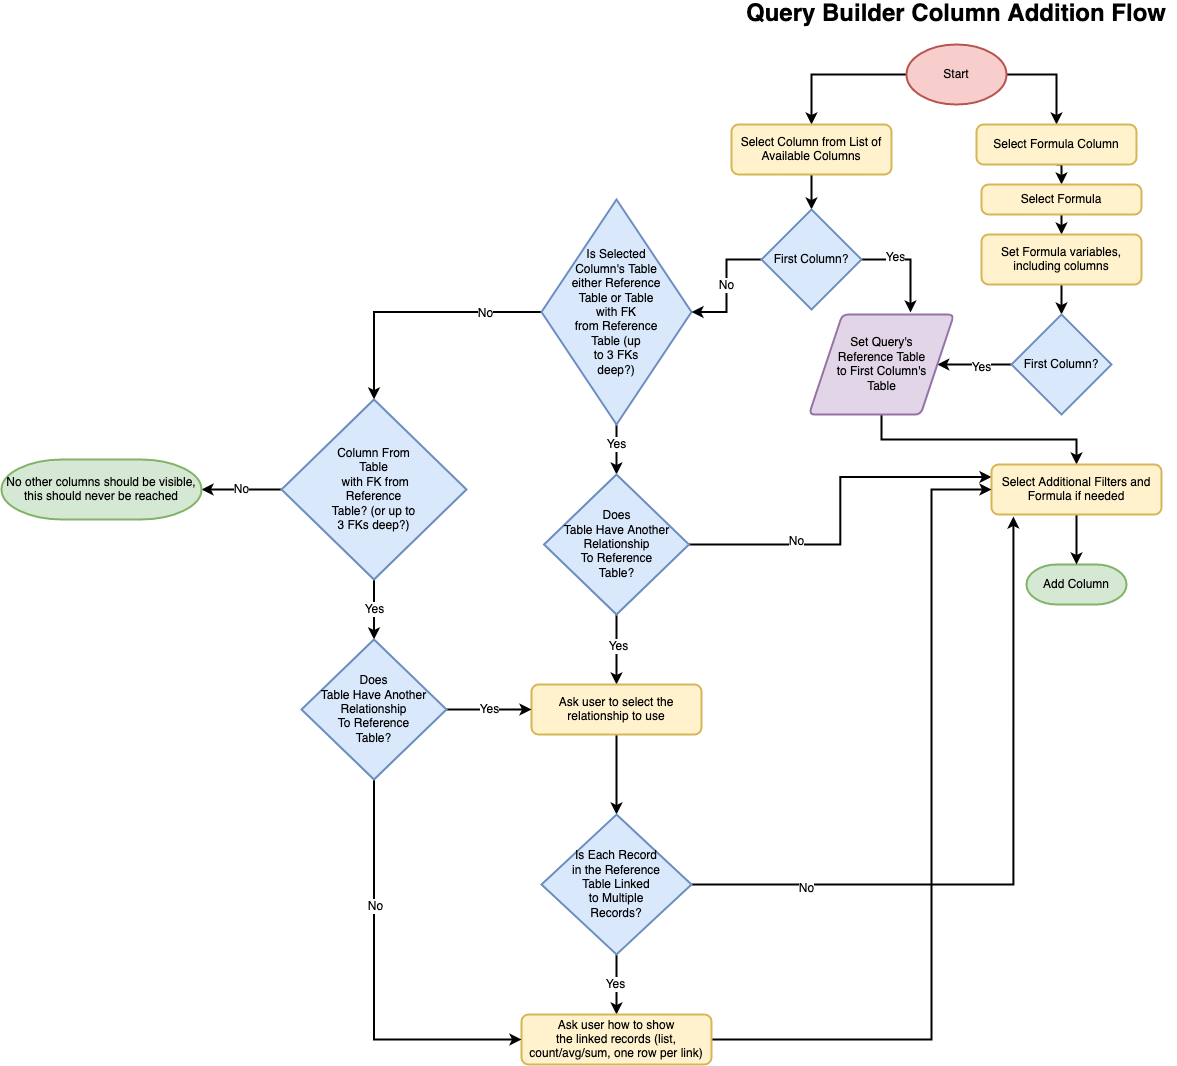
Flowchart
Here’s a flowchart of decisions that need to be made when adding columns. This is meant to be an illustrative example; we might end up making decisions in a different order or replacing some decisions with assumptions that the user can then change.
Query Refinement
In addition to selecting output columns, the user should be able to add to the query in the following ways.
Filtering
The user can add filters to filter down the results of the query to a subset of rows. They can use any of the query’s output columns in filters. The filters available for the column will depend its data type and will offer a similar experience to table or view filters.
Sorting
The user can sort the query results by one or more of the query’s output columns. Query sorting should provide a similar experience to table or view sorting.
Summarization
The user should be able to summarize the query by one of the query’s output columns. This involves the following steps:
- The user selects a column to summarize on and the summary type.
- The type of summary will depend on the column’s data type.
- The summarizations offered for a given data type will match that data type’s grouping options in tables/views.
- Users can summarize based on multiple columns, just like they can group by multiple columns.
- The summarization is applied to the query results as follows:
- the values in the summary’s target column are reduced to the group names
- the values of rest of the columns are aggregated into a list of distinct values.
Once an summarization is applied, then any new columns added will also be aggregated as a list. The user can change how columns are aggregated on a column-by-column basis.
To keep things simple, only one summarization can be applied at a time. This means that users are limited to one summarization step at a time, but they can use multiple columns to create that summary.
Example 1: Summarize single column by “first letter” grouping option
Consider this query output:
| Movie Title | Runtime | Genres |
|---|---|---|
| Rocket Science | 1 hr 41 min | Comedy, Drama |
| The Last Duel | 2 hr 32 min | Action, Drama, History |
| Road to Perdition | 1 hr 57 min | Crime, Drama, Thriller |
| The Count of Monte Cristo | 2 hr 11 min | Adventure |
| On the Rocks | 1 hr 37 min | Comedy, Drama |
The user applies a summary of “Movie Title” by first letter. The resultant output will be:
| Movie Title (First Letter) | Runtime | Genres |
|---|---|---|
| O | 1 hr 37 min | Comedy, Drama |
| R | 1 hr 41 min, 1 hr 57 min | Comedy, Crime, Drama, Thriller |
| T | 2 hr 11 min, 2 hr 32 min | Adventure, Action, Drama, History |
Example 2: Summarize multiple columns by distinct values
Consider this de-normalized input table.
| student_id | student_name | student_email | professor_name | subject | grade |
|---|---|---|---|---|---|
| 1234123412 | Alice | alice@uni.edu | Bob | Math | 82 |
| 1234123412 | Alice | alice@uni.edu | Carol | Reading | 97 |
| 1234123412 | Alice | alice@uni.edu | David | Writing | 92 |
| 1234123412 | Alice | alice@uno.edu | Edith | Science | 72 |
| 1234123412 | Alice | alice@uni.edu | Frank | Music | 46 |
| 7890789078 | George | george@uni.edu | Bob | Math | 82 |
| 7890789078 | Georg | george@uni.edu | Henrietta | Reading | 54 |
| 7890789078 | George | george@uni.com | Igor | Writing | 71 |
| 7890789078 | George | george@uni.edu | Jennifer | Science | 84 |
| 7890789078 | George | george@uni.edu | Kenneth | Music | 100 |
The user applies a summary of “Distinct Values” with columns “student_id”, “student_name”, “student_email”. The resultant output will be:
| student_id | student_name | student_email |
|---|---|---|
| 1234123412 | Alice | alice@uni.edu |
| 1234123412 | Alice | alice@uno.edu |
| 7890789078 | Georg | george@uni.edu |
| 7890789078 | George | george@uni.com |
| 7890789078 | George | george@uni.edu |
Limit & Offset
The user can apply the following to the query:
- A limit to the number of rows returned
- An offset for where to start the rows returned
Preview
- We should show users a live preview of their data as they build their query.
- The preview should support changing display options for output columns based on their data type.
Other Actions
- We should allow users to see a temporary view of their query (this won’t be saved as a View but they won’t see the “query building” part of the screen)
- We should allow users to save their query as a permanent View.
Implementation Details
Available Columns
When adding query output columns, available columns are calculated as follows:
- If a base table has not been set, we show all columns from all tables.
- We may want to hide columns with foreign key constraints (FKs), since they are duplicates of the source columns.
- If a base table has been set, we show:
- all columns from the base table
- If the base table has no relationships to itself within three levels, then we can hide columns from the base table that have already been added to the query’s output columns
- all columns from tables that the base table has FKs to or with FKs to the base table, up to three levels of FKs away.
- all columns from the base table
Formulas
Please see the next page, 04. Formulas.
Column Input Filters
When applying filters to an input column (let’s call it X), the user selects three things:
- Column to apply the filter to: This could be
- any column in the table (
T) thatXbelongs to - any column in any table that
Thas a FK relationship to (i.e. there’s a single related record to every record inT), up to three levels deep
- any column in the table (
- Filter operator: This depends on the data type of the column selected in the first parameter e.g.
contains - Filter parameter: This can be either a literal value or another column. Columns available here are:
- any column in the table (
T) thatXbelongs to - any column in any table that
Thas a FK relationship to (i.e. there’s a single related record to every record inT), up to three levels deep - any column in the base table (
Q) of the query - any column in any table that
Qhas a FK relationship to (i.e. there’s a single related record to every record inQ), up to three levels deep - any column already added to the query
- any column in the table (