Inventory Use Case
People usually need inventories to keep track of things they own or manage. Creating and using these inventories within Mathesar shouldn’t be too different from creating any other spreadsheet. Most of the steps in this process aren’t new to users, making inventory an ideal use case to build first.
Use Case Goals
A use case describes the interaction between a user and a system to achieve a goal. The primary user goal for this use case is to create their inventory using Mathesar, either from scratch or by importing their existing data. To help users achieve this goal, we aim to design an intuitive application to perform all steps of inventory creation in a similar fashion to typical spreadsheets.
Preconditions
- The user is not looking to collaborate with other users within Mathesar at the moment
- The user already has a CSV file with catalog items
- The user has access to a server for the installation
Termination Outcomes
- The user can complete every step of the basic inventory flow without requiring external assistance or resources outside of Mathesar
- The user can build their inventory from scratch or using existing data
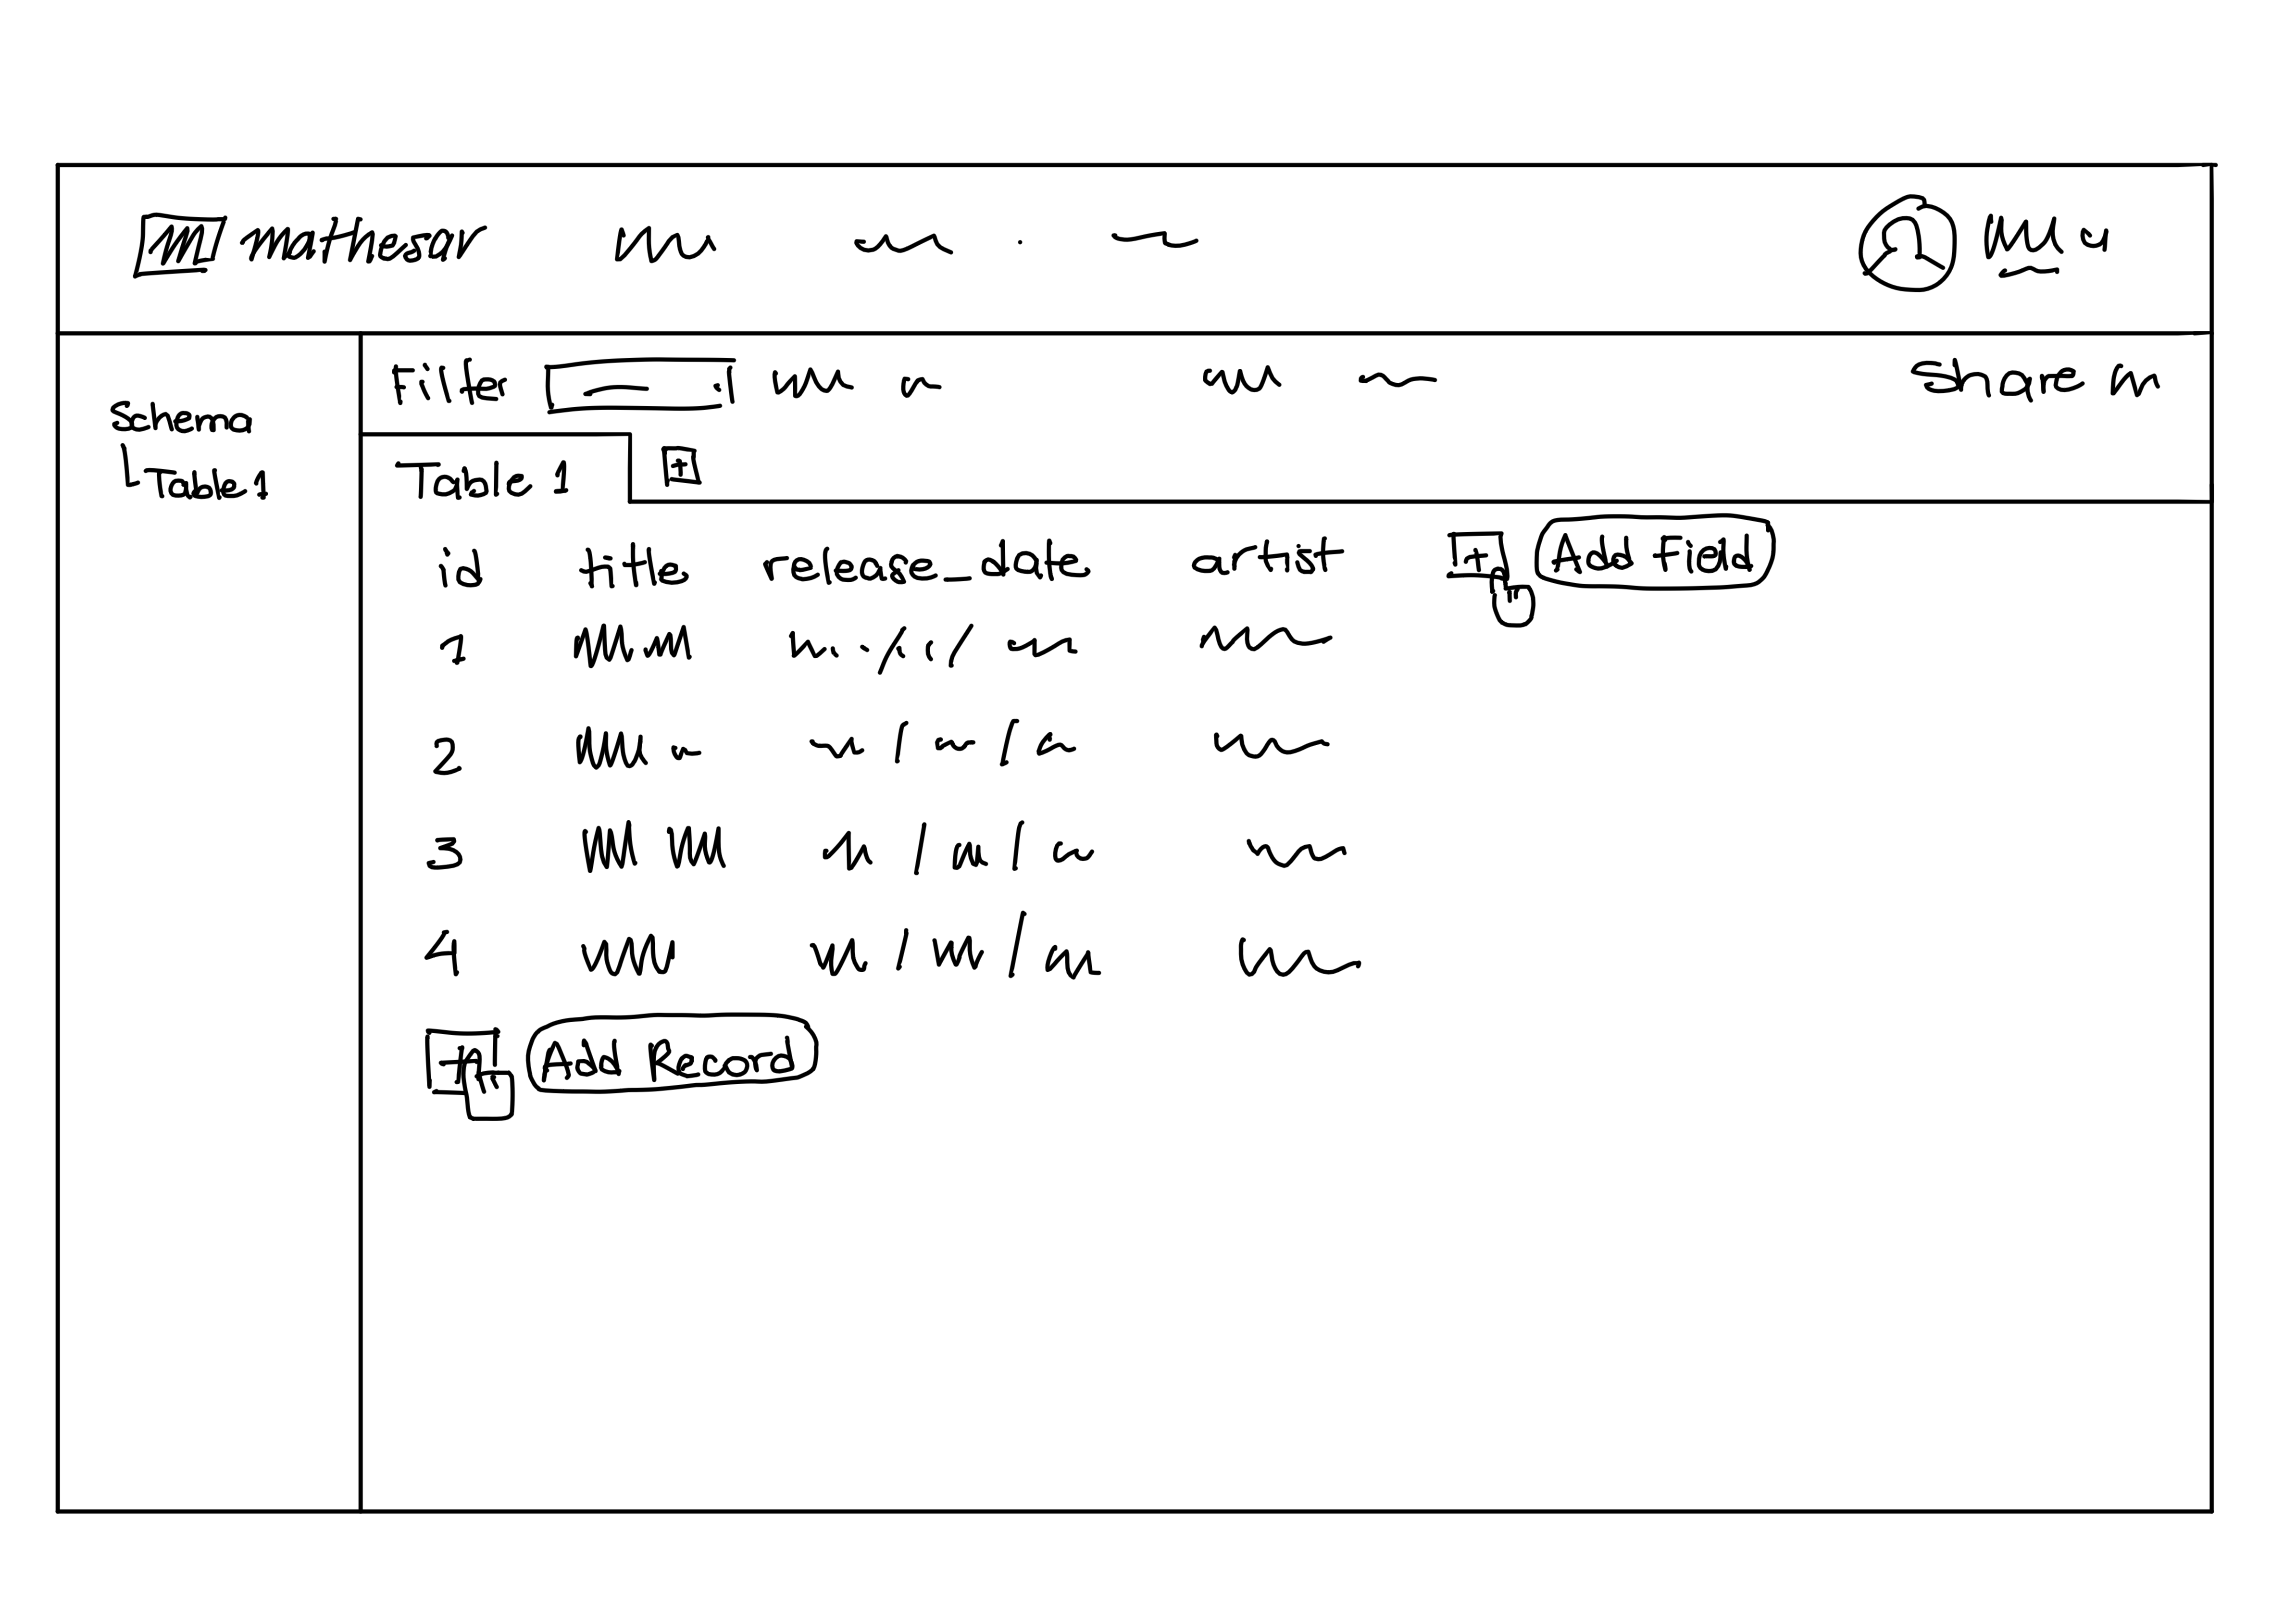
- The user can modify their inventory content (e.g., add, delete, edit records or fields)
- The user can modify their inventory presentation (e.g., filtering, sorting)
- The user can perform simple statistical analysis of their inventory data (e.g., count, frequency, etc.)
- The user can search through their inventory and retrieve a record
Questions We Want To Answer
- Are we aware of all the critical steps required to fulfill the inventory use case?
- Are there any opportunities to simplify the steps, eliminate complexity?
- Are there any risks that we can avoid or eliminate by modifying or introducing steps?
The Design Process
Visit the Design Process section to read an overview of the product design process that the team will follow to build the inventory prototype. This design will include the user experience, user interface and interactions, and the underlying features and patterns.
Inventory Use Case Basic Flow
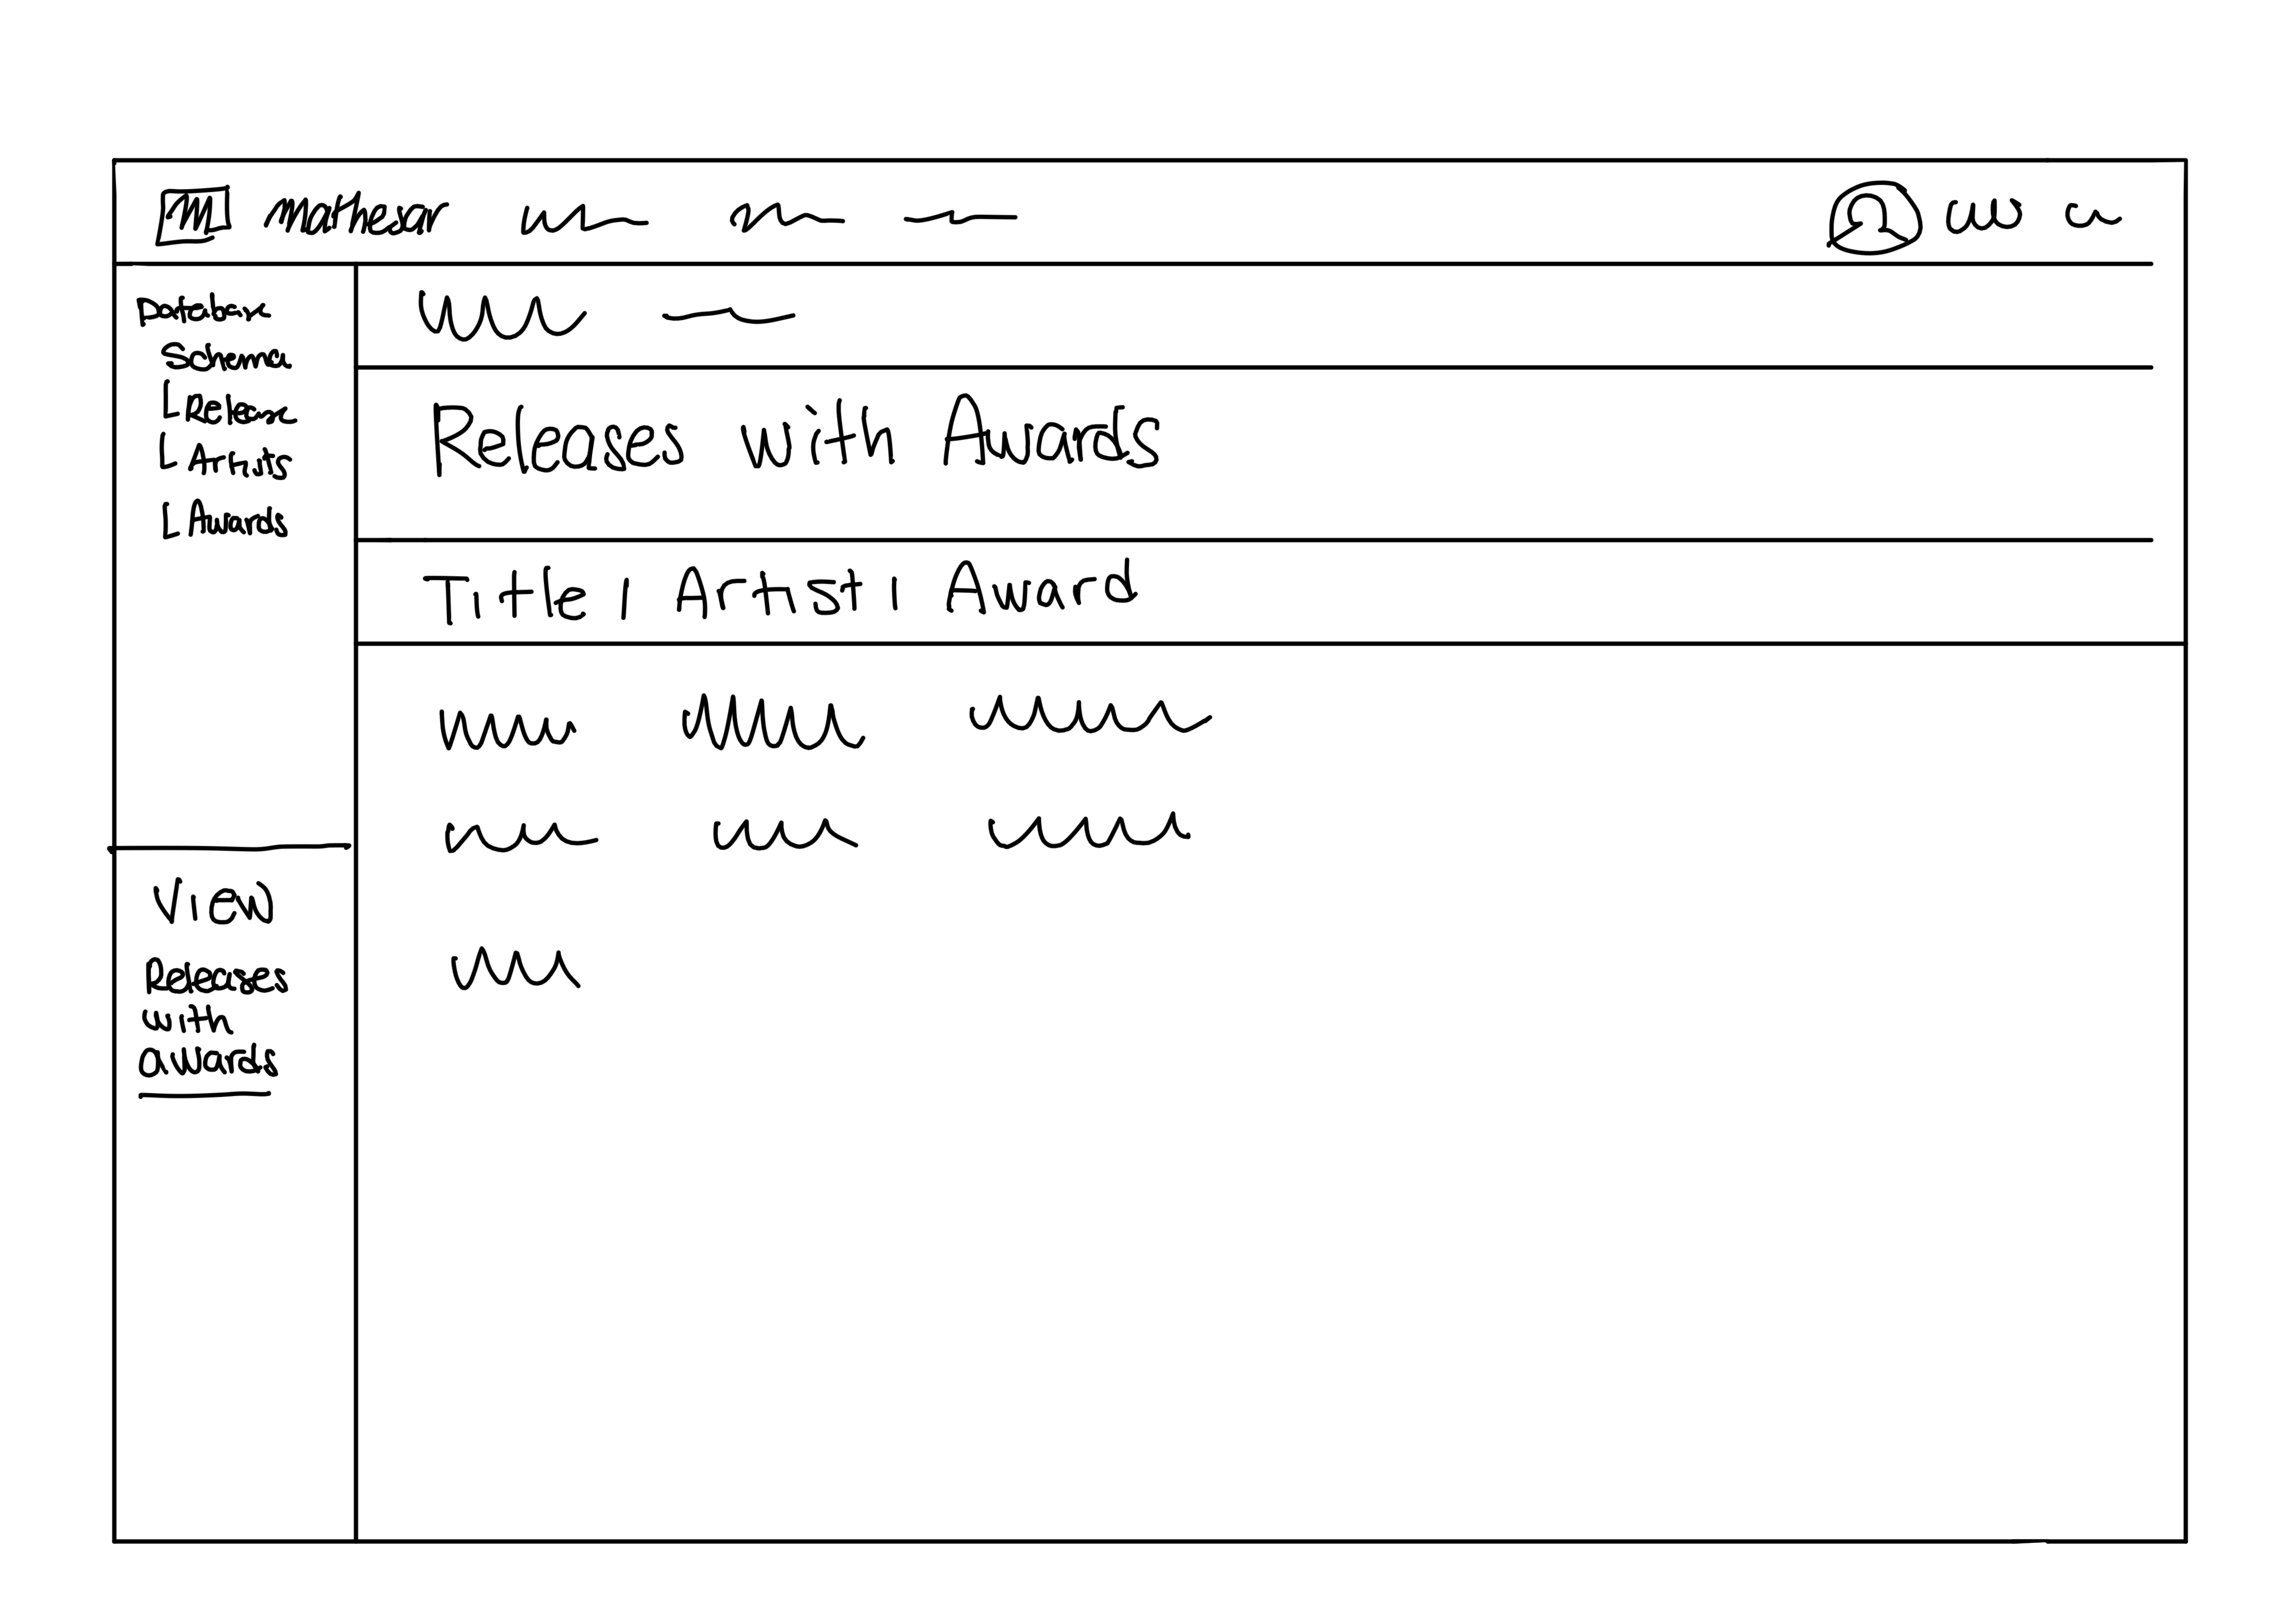
Information
These wireframes are meant to work as abstract representations of the user journey. Content and layout will most likely change as we add more definitions to each step.
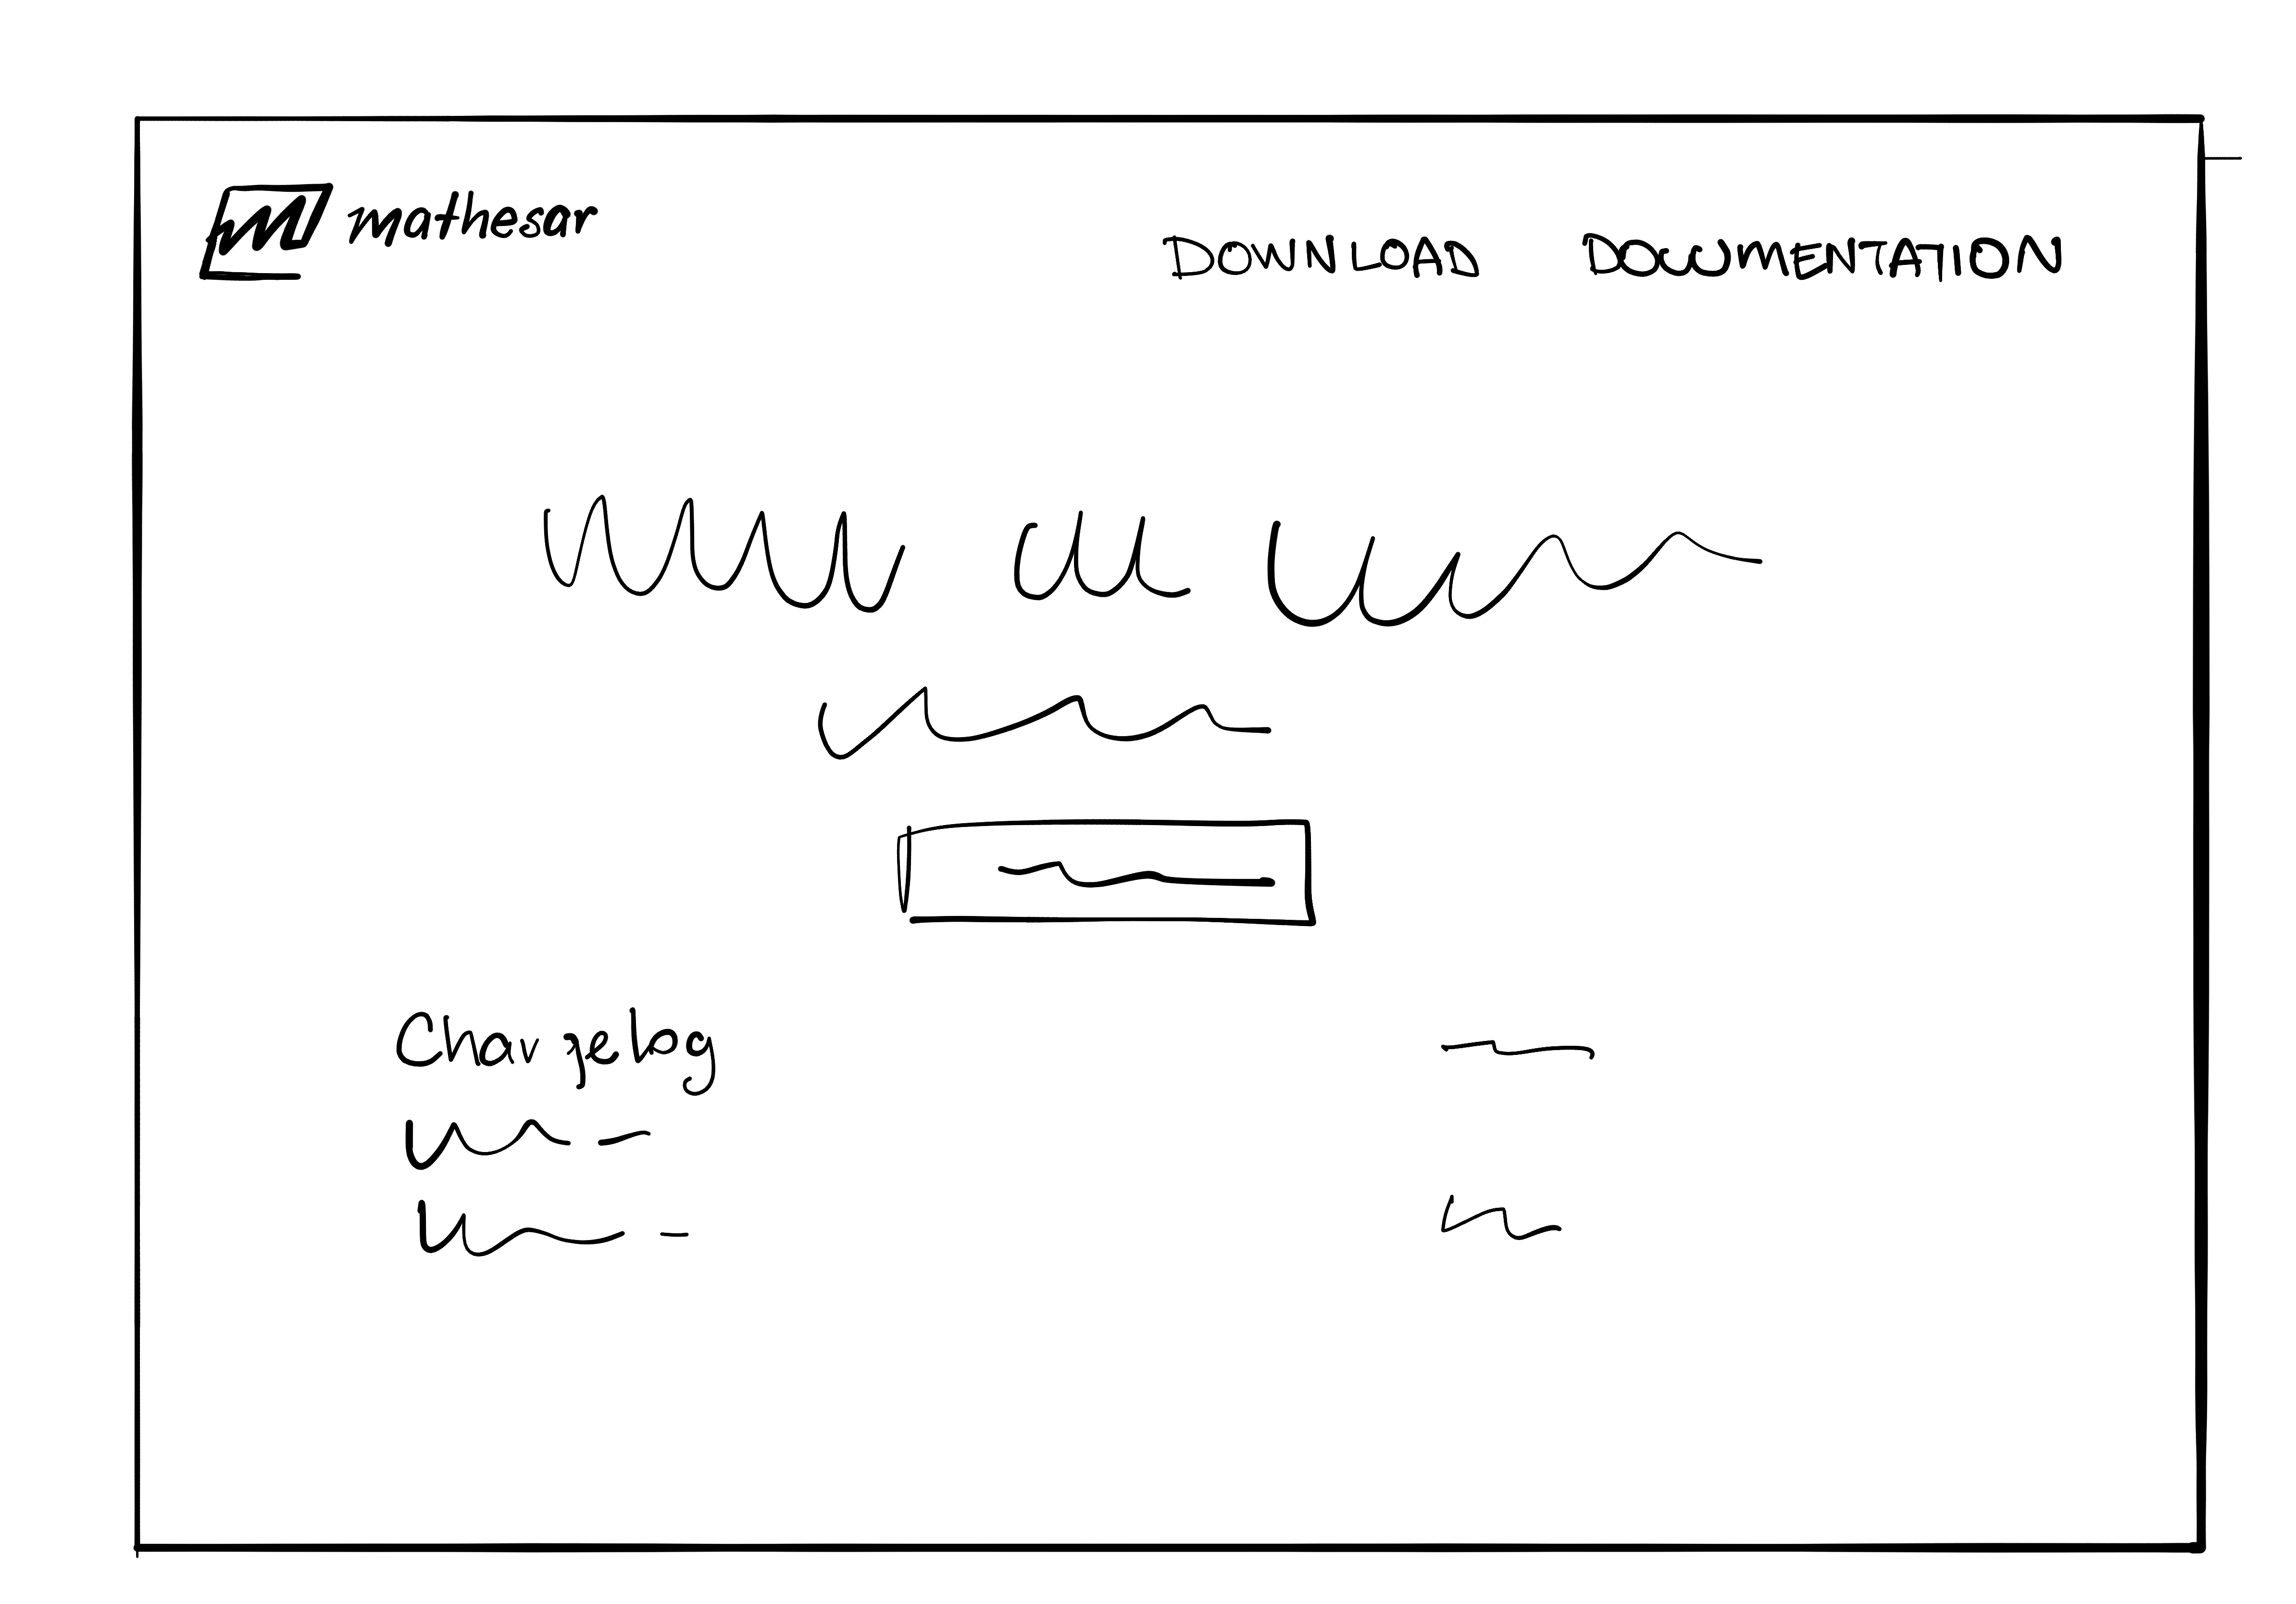
- User visits Mathesar’s website or documentation, reads about the features and finds the documentation quickly.
- User locates a list of features and confirms Mathesar will solve their problem.
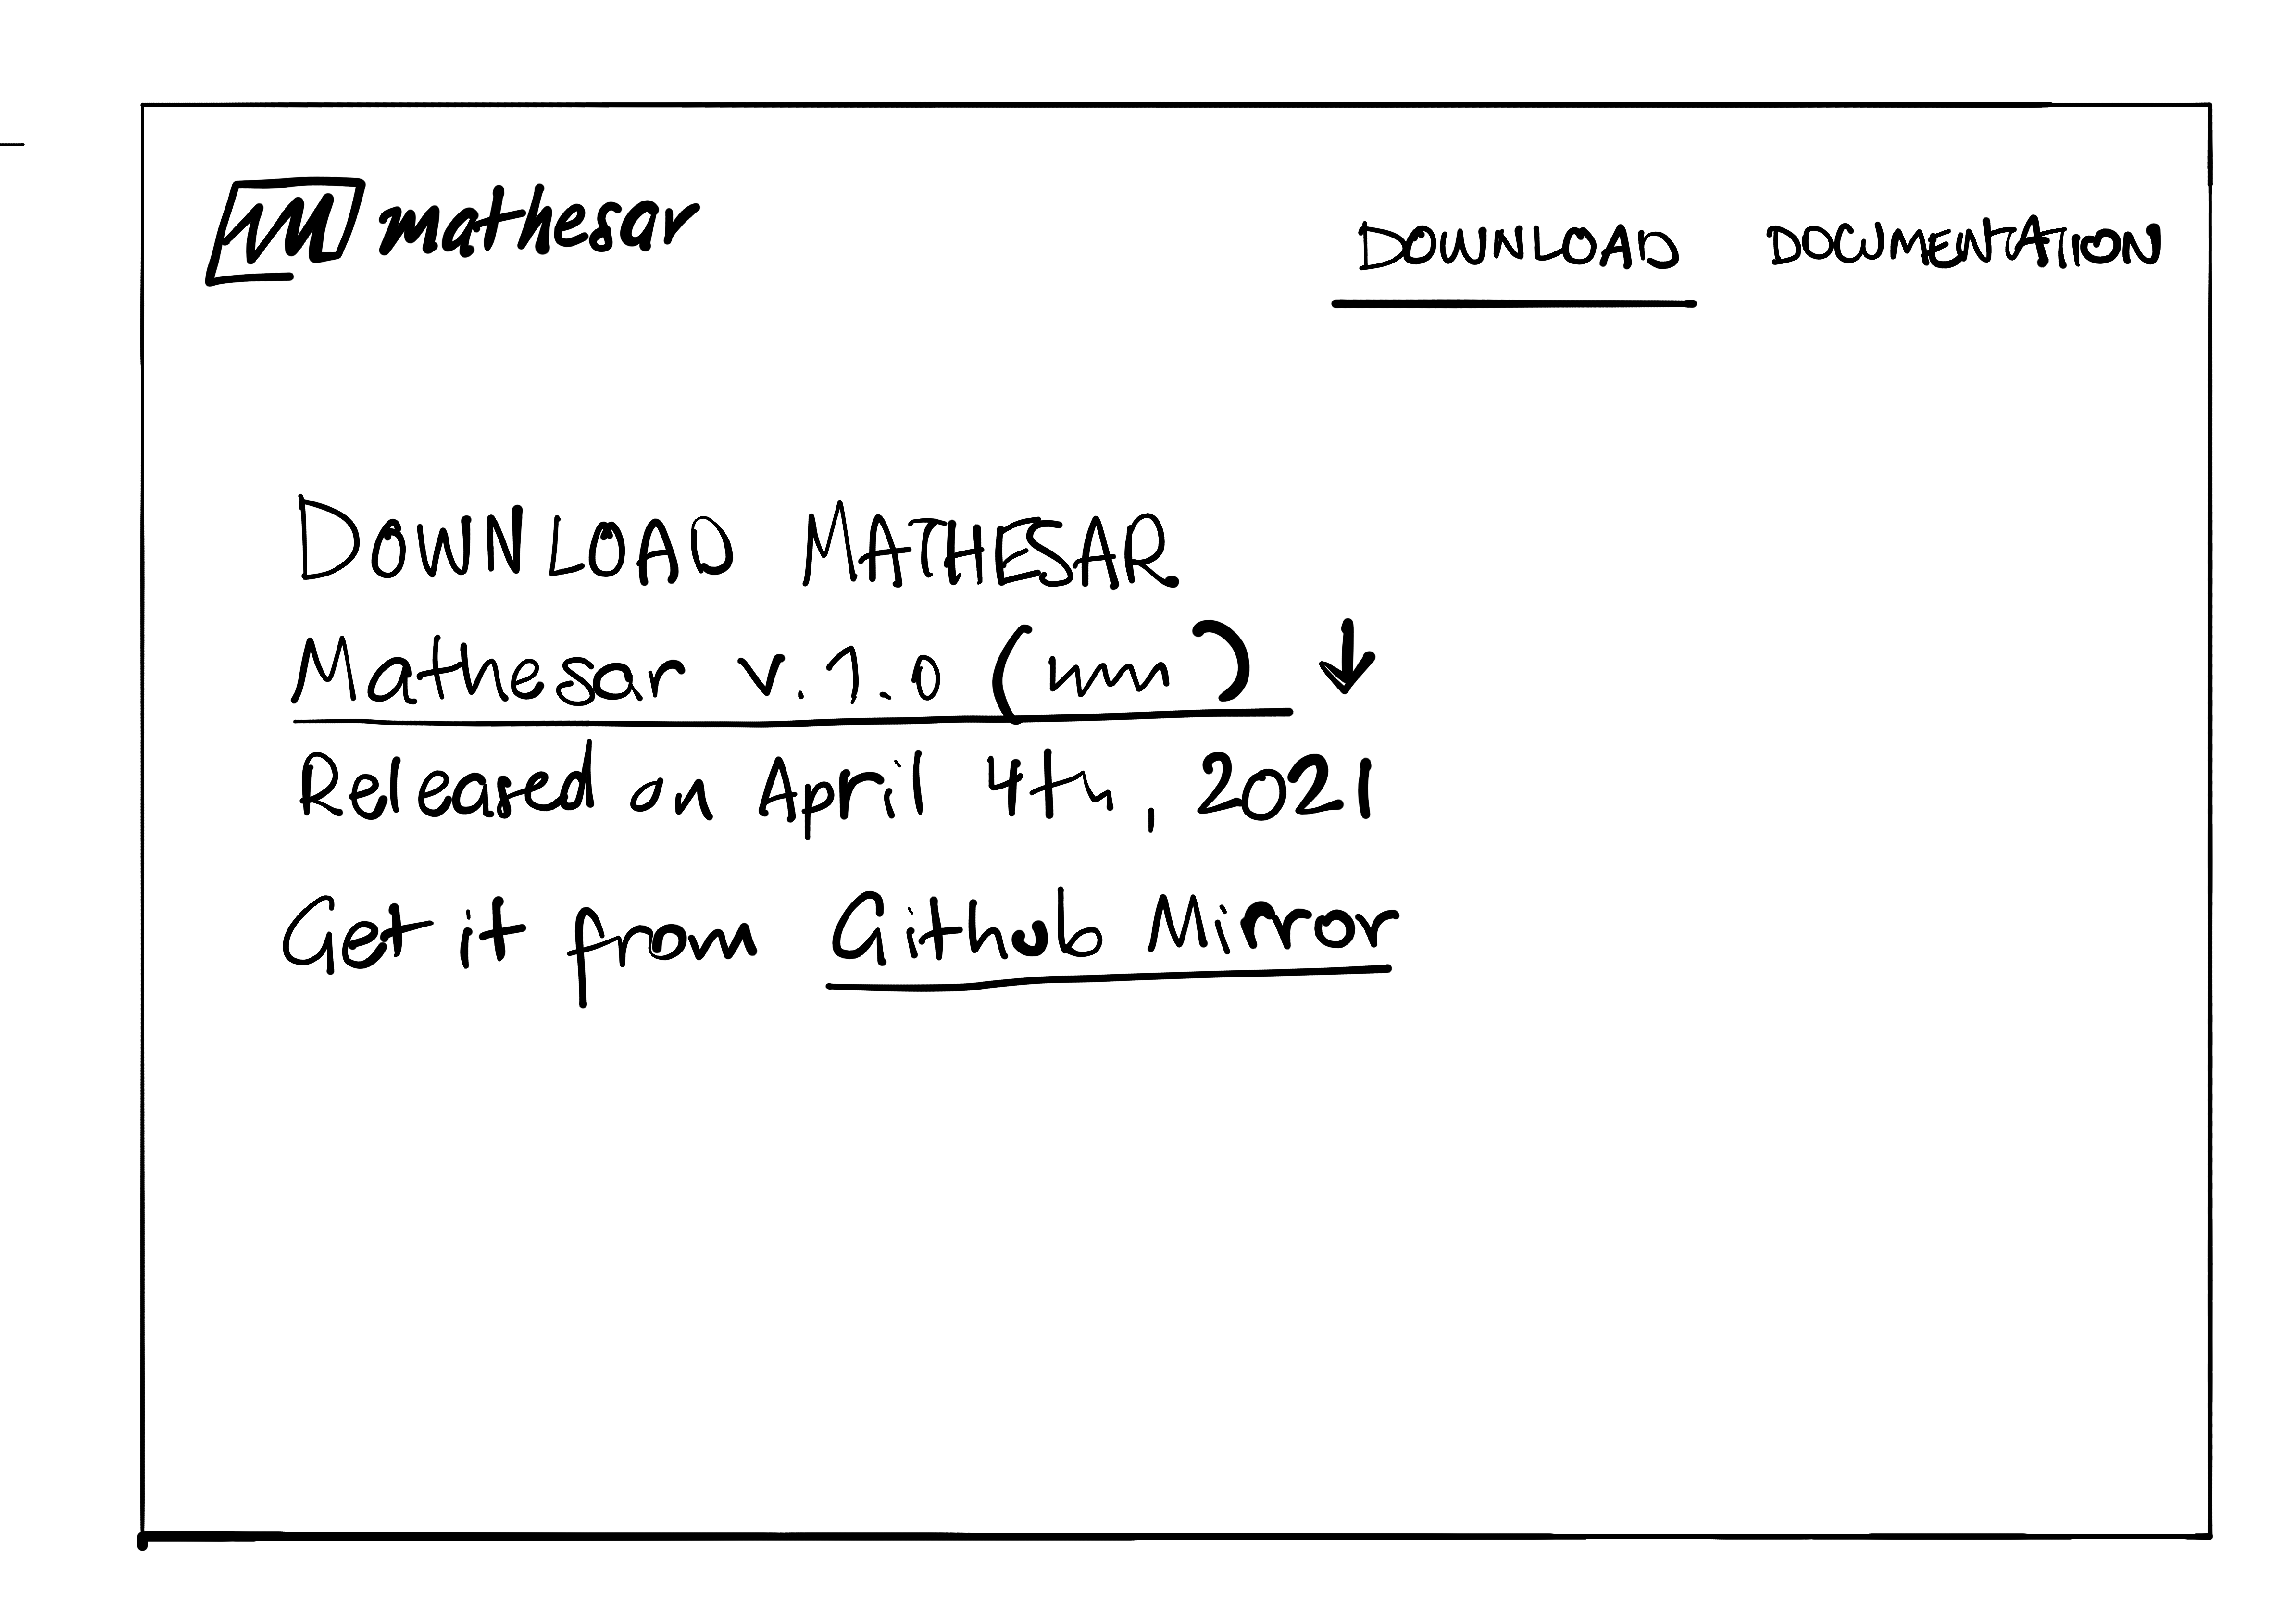
- User locates a list of requirements and confirms they have what it takes to install and run Mathesar.
- The user downloads the files (zip file or pull code from GitHub mirror) and places them on a server. The user follows additional configuration steps and other tuning required to install Mathesar.
-
The user creates a database to use with Mathesar. The user can perform this step as a standalone operation or part of the installation process if they don’t have a database.
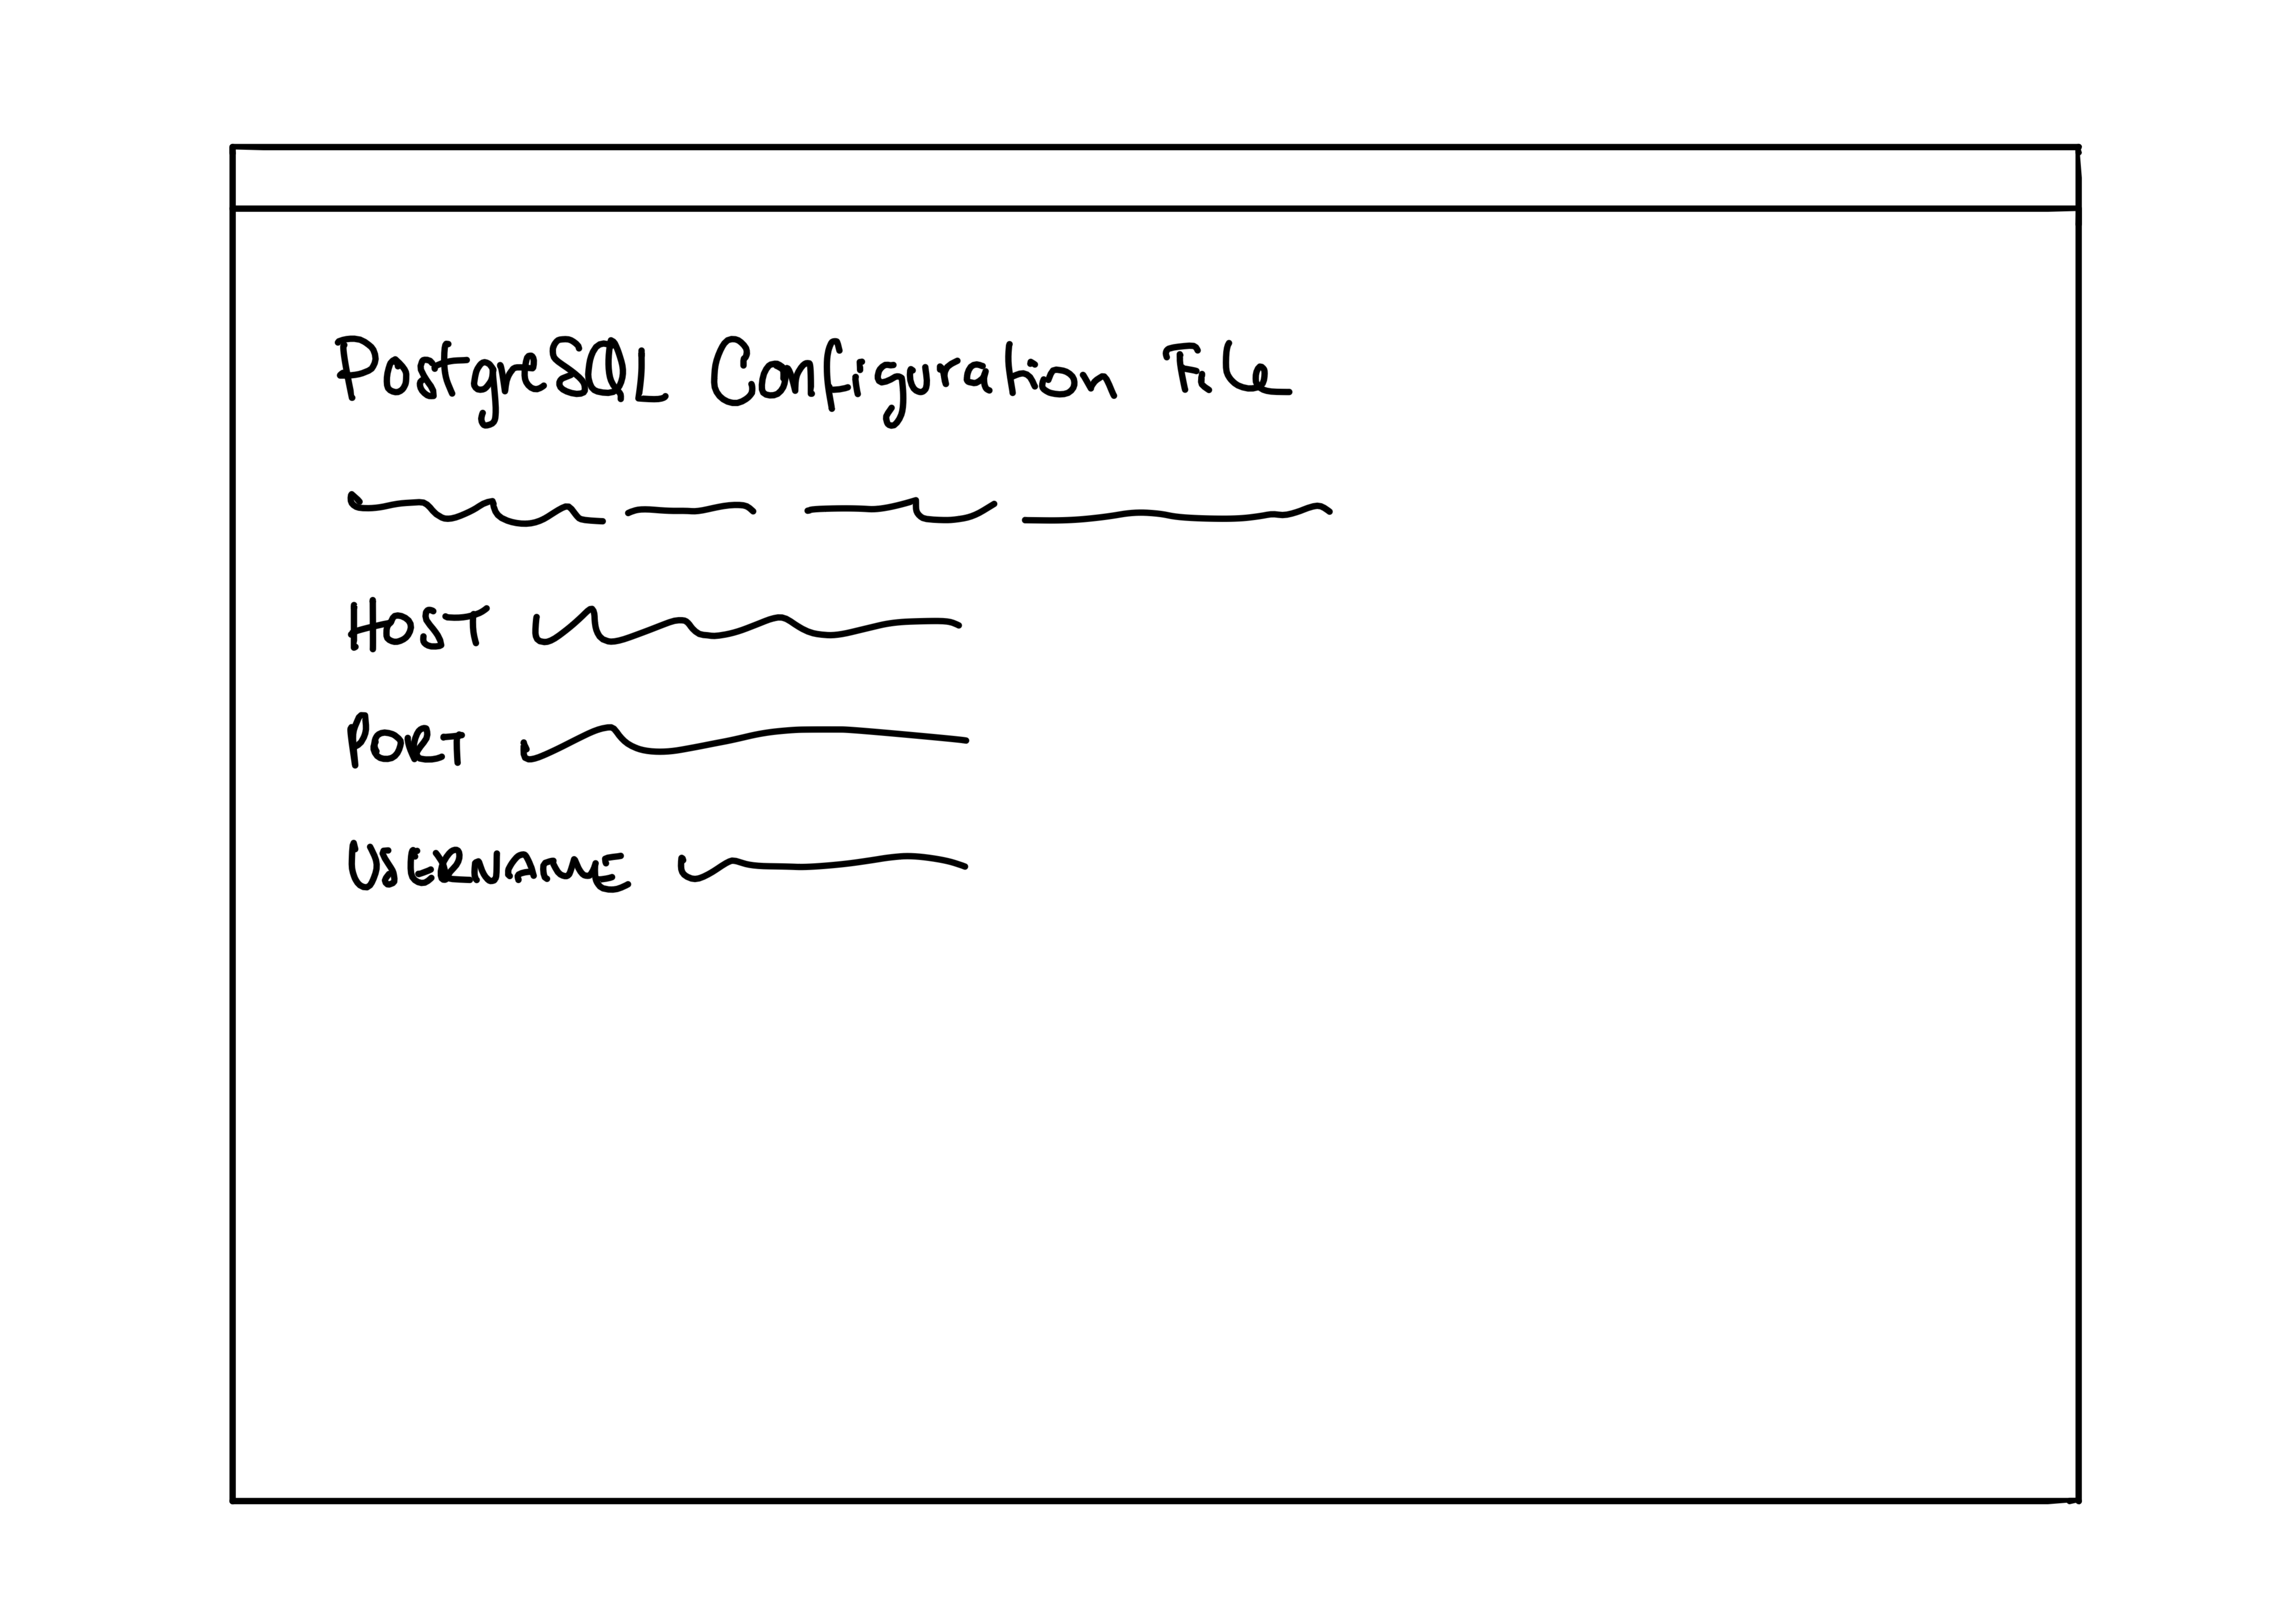
-
By following the documentation instructions, the user locates the database config file and edits the information (database name, user, password, host, etc.).
-
The user runs the install.
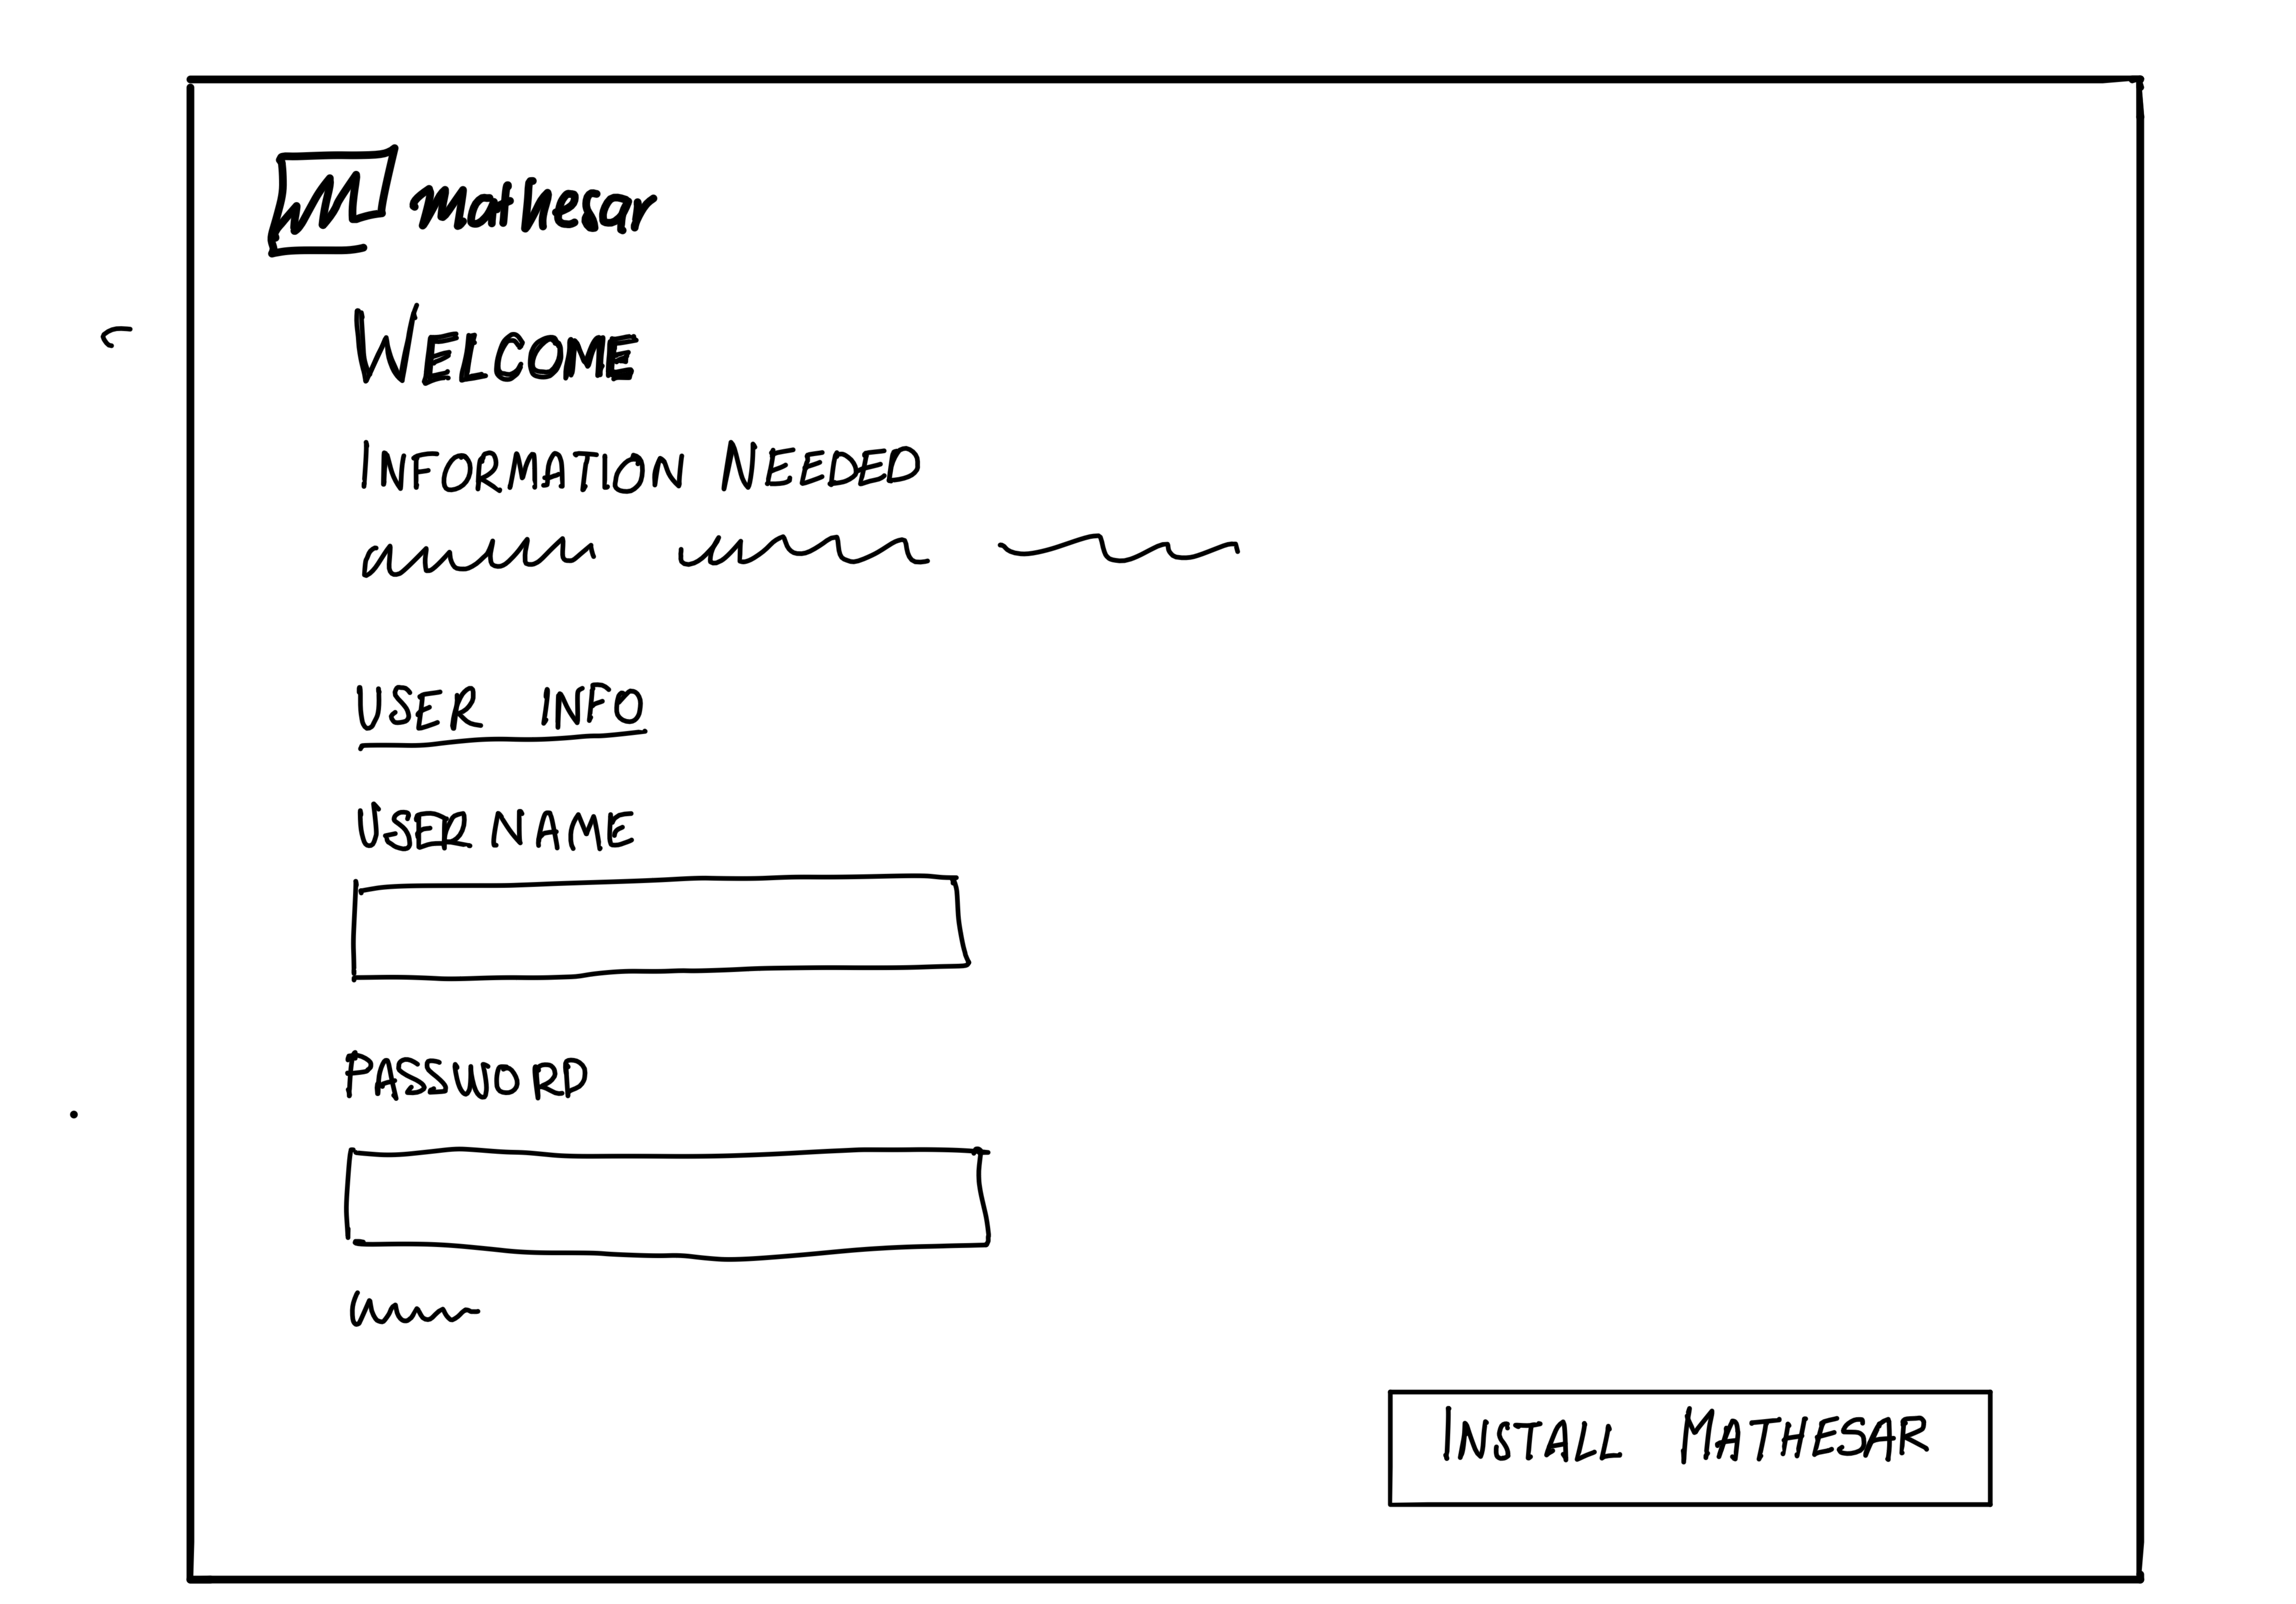
-
The user completes some administration settings (create user, email) and can now start using Mathesar.
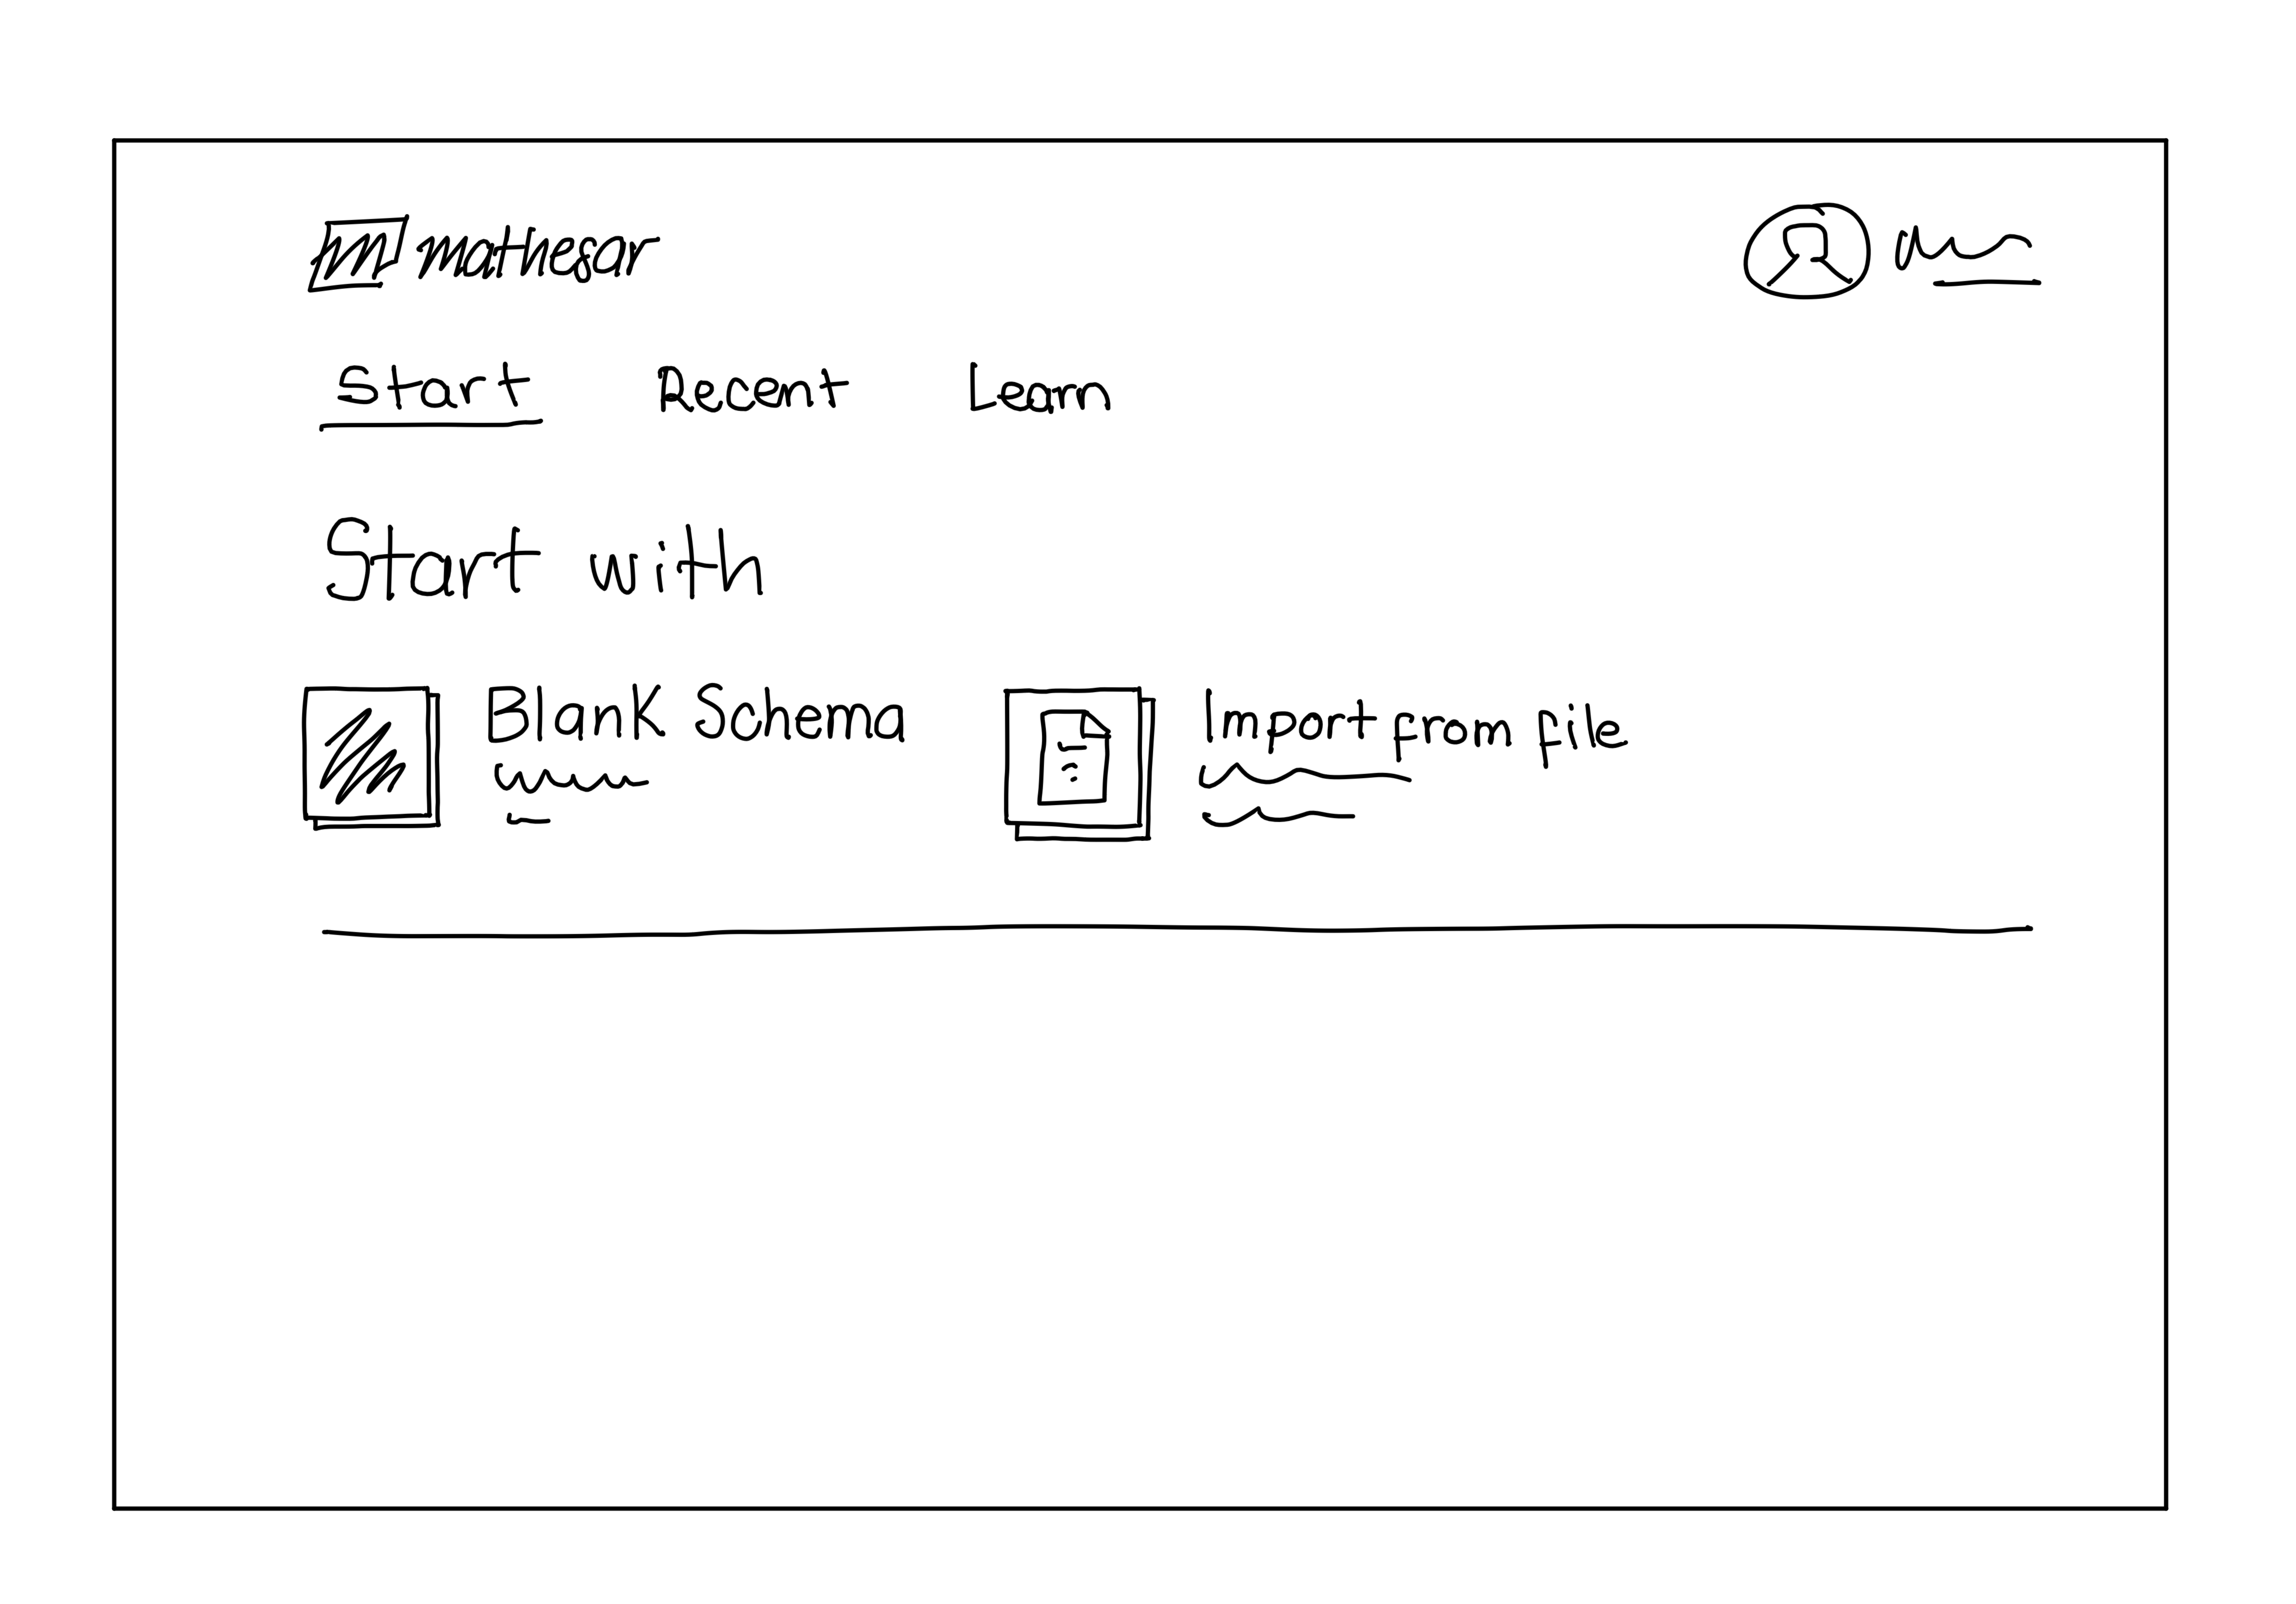
-
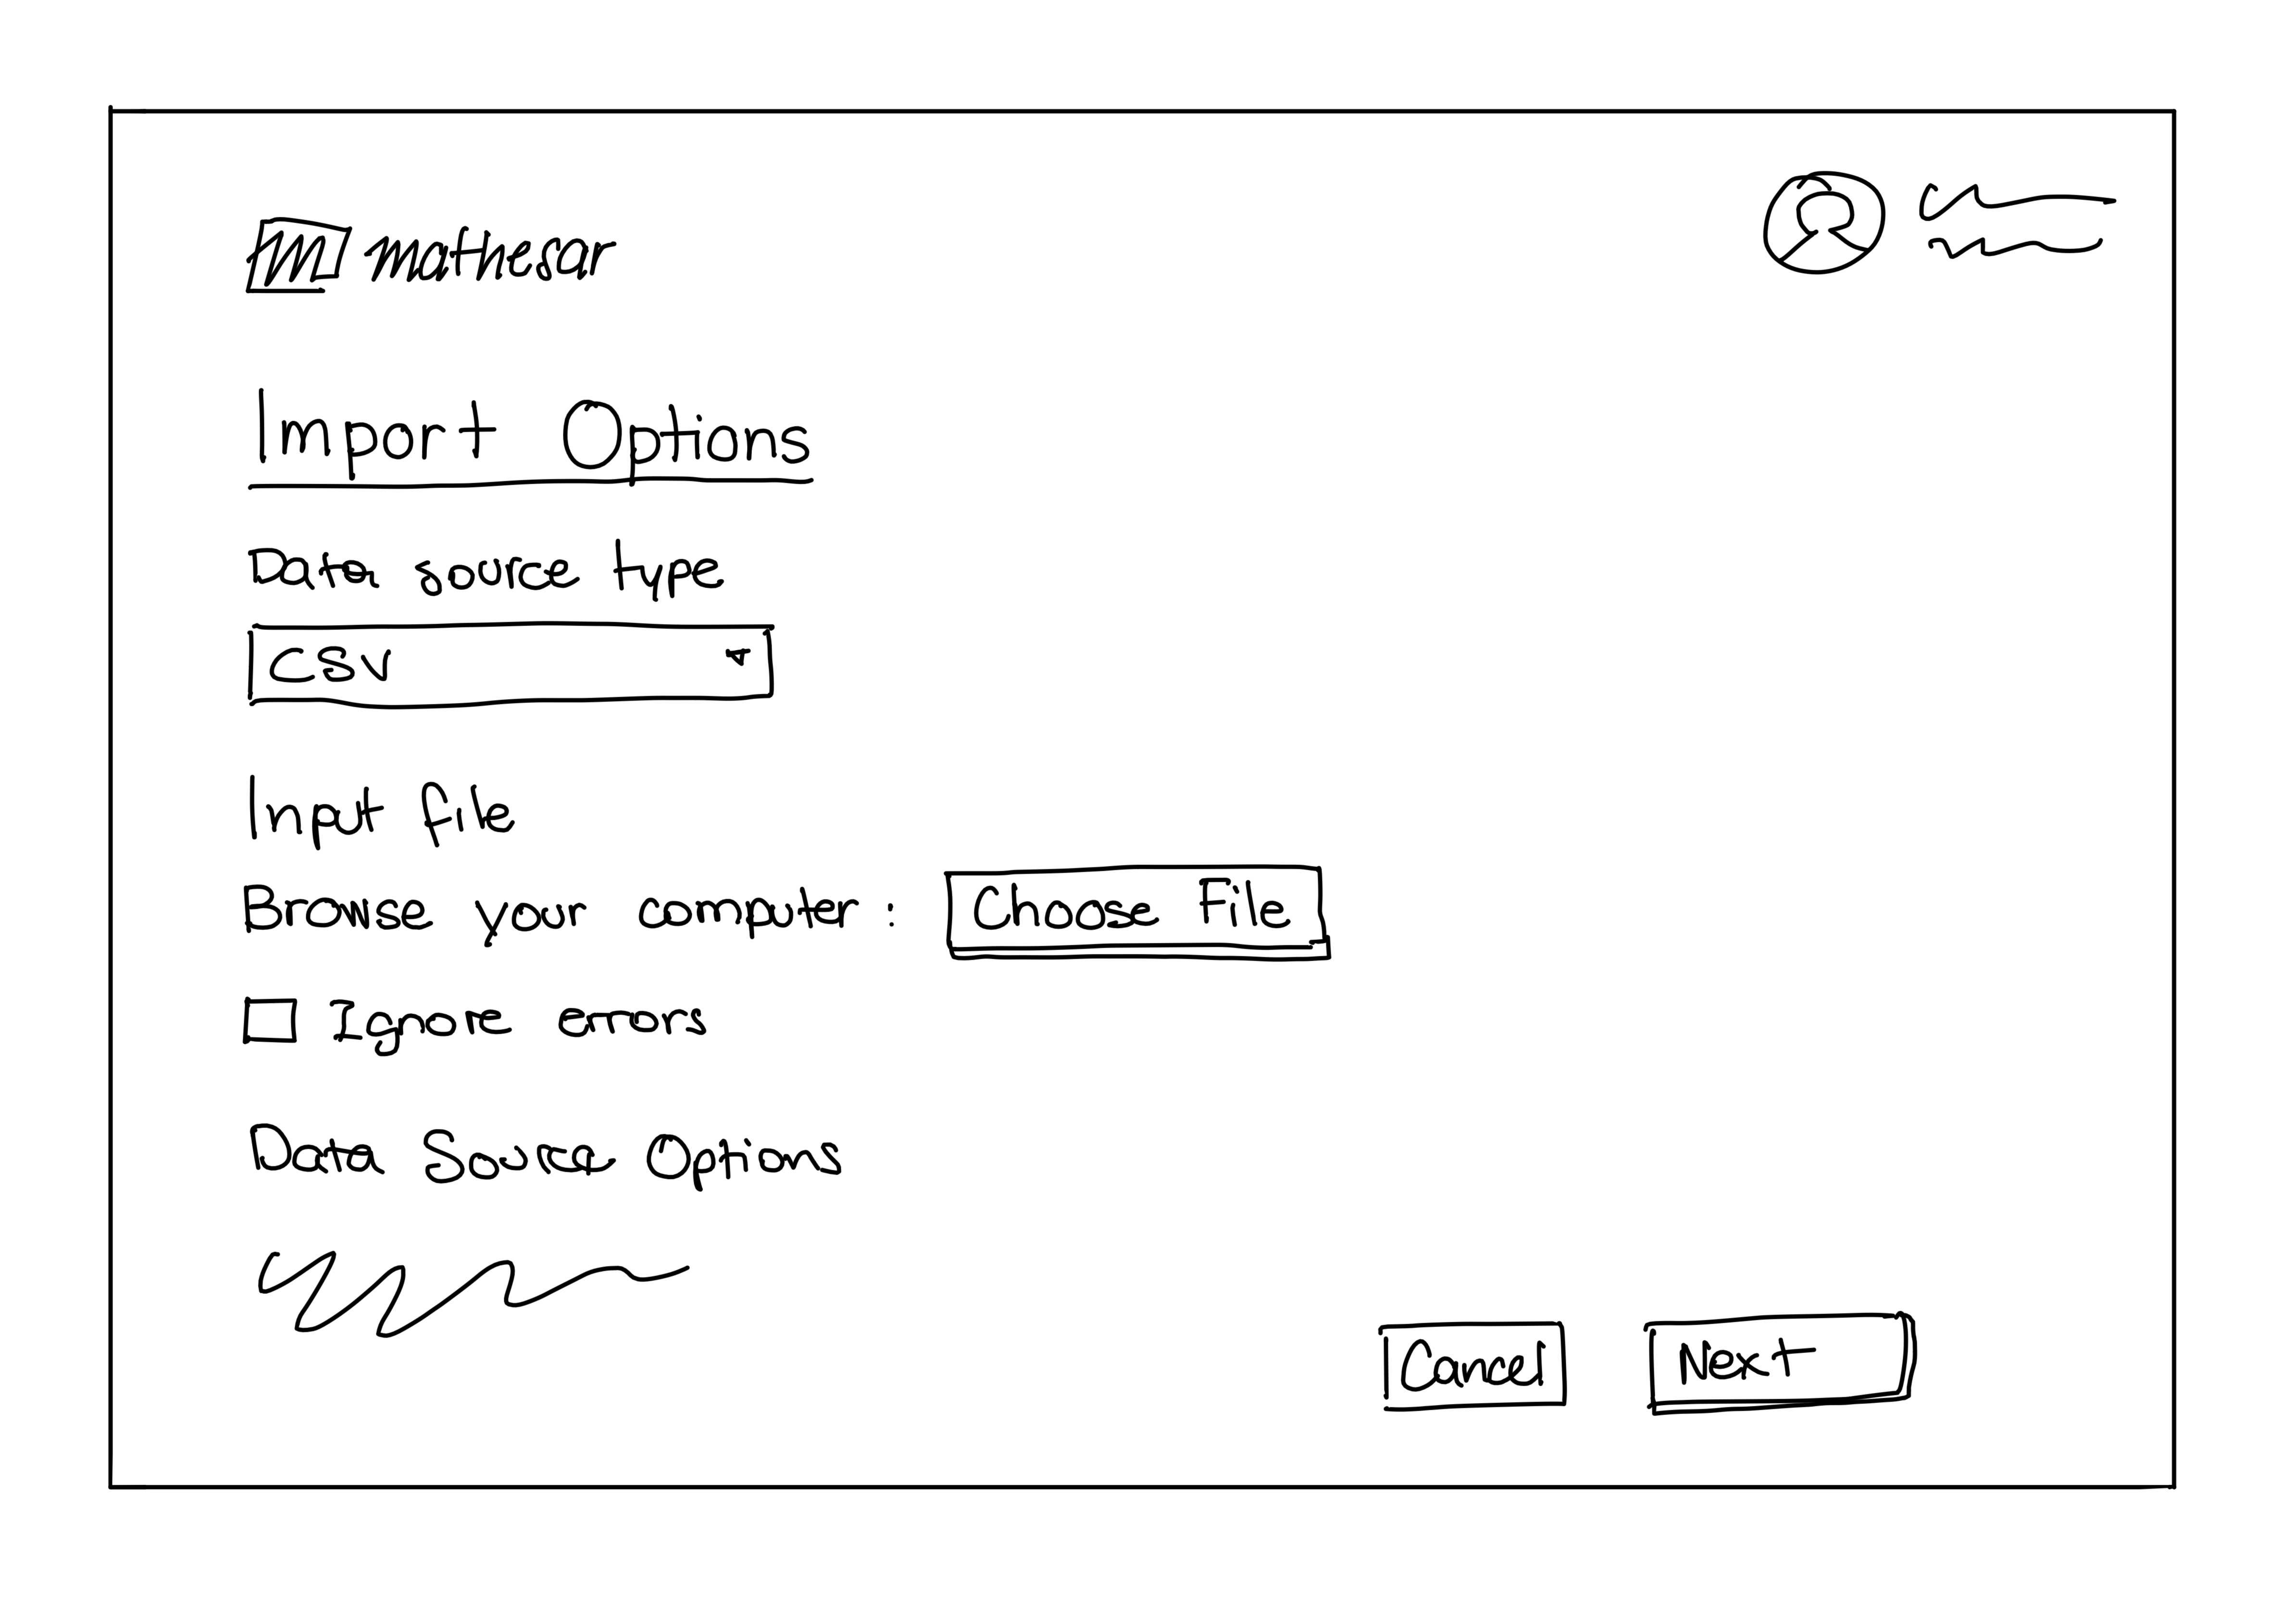
The user is taken to a page that displays different options to start working with Mathesar. They can choose to create a new schema or import data from a file. The user decides to import from a file and navigates to the import options view.
- The user reviews the import preview and data types that the system detected automatically
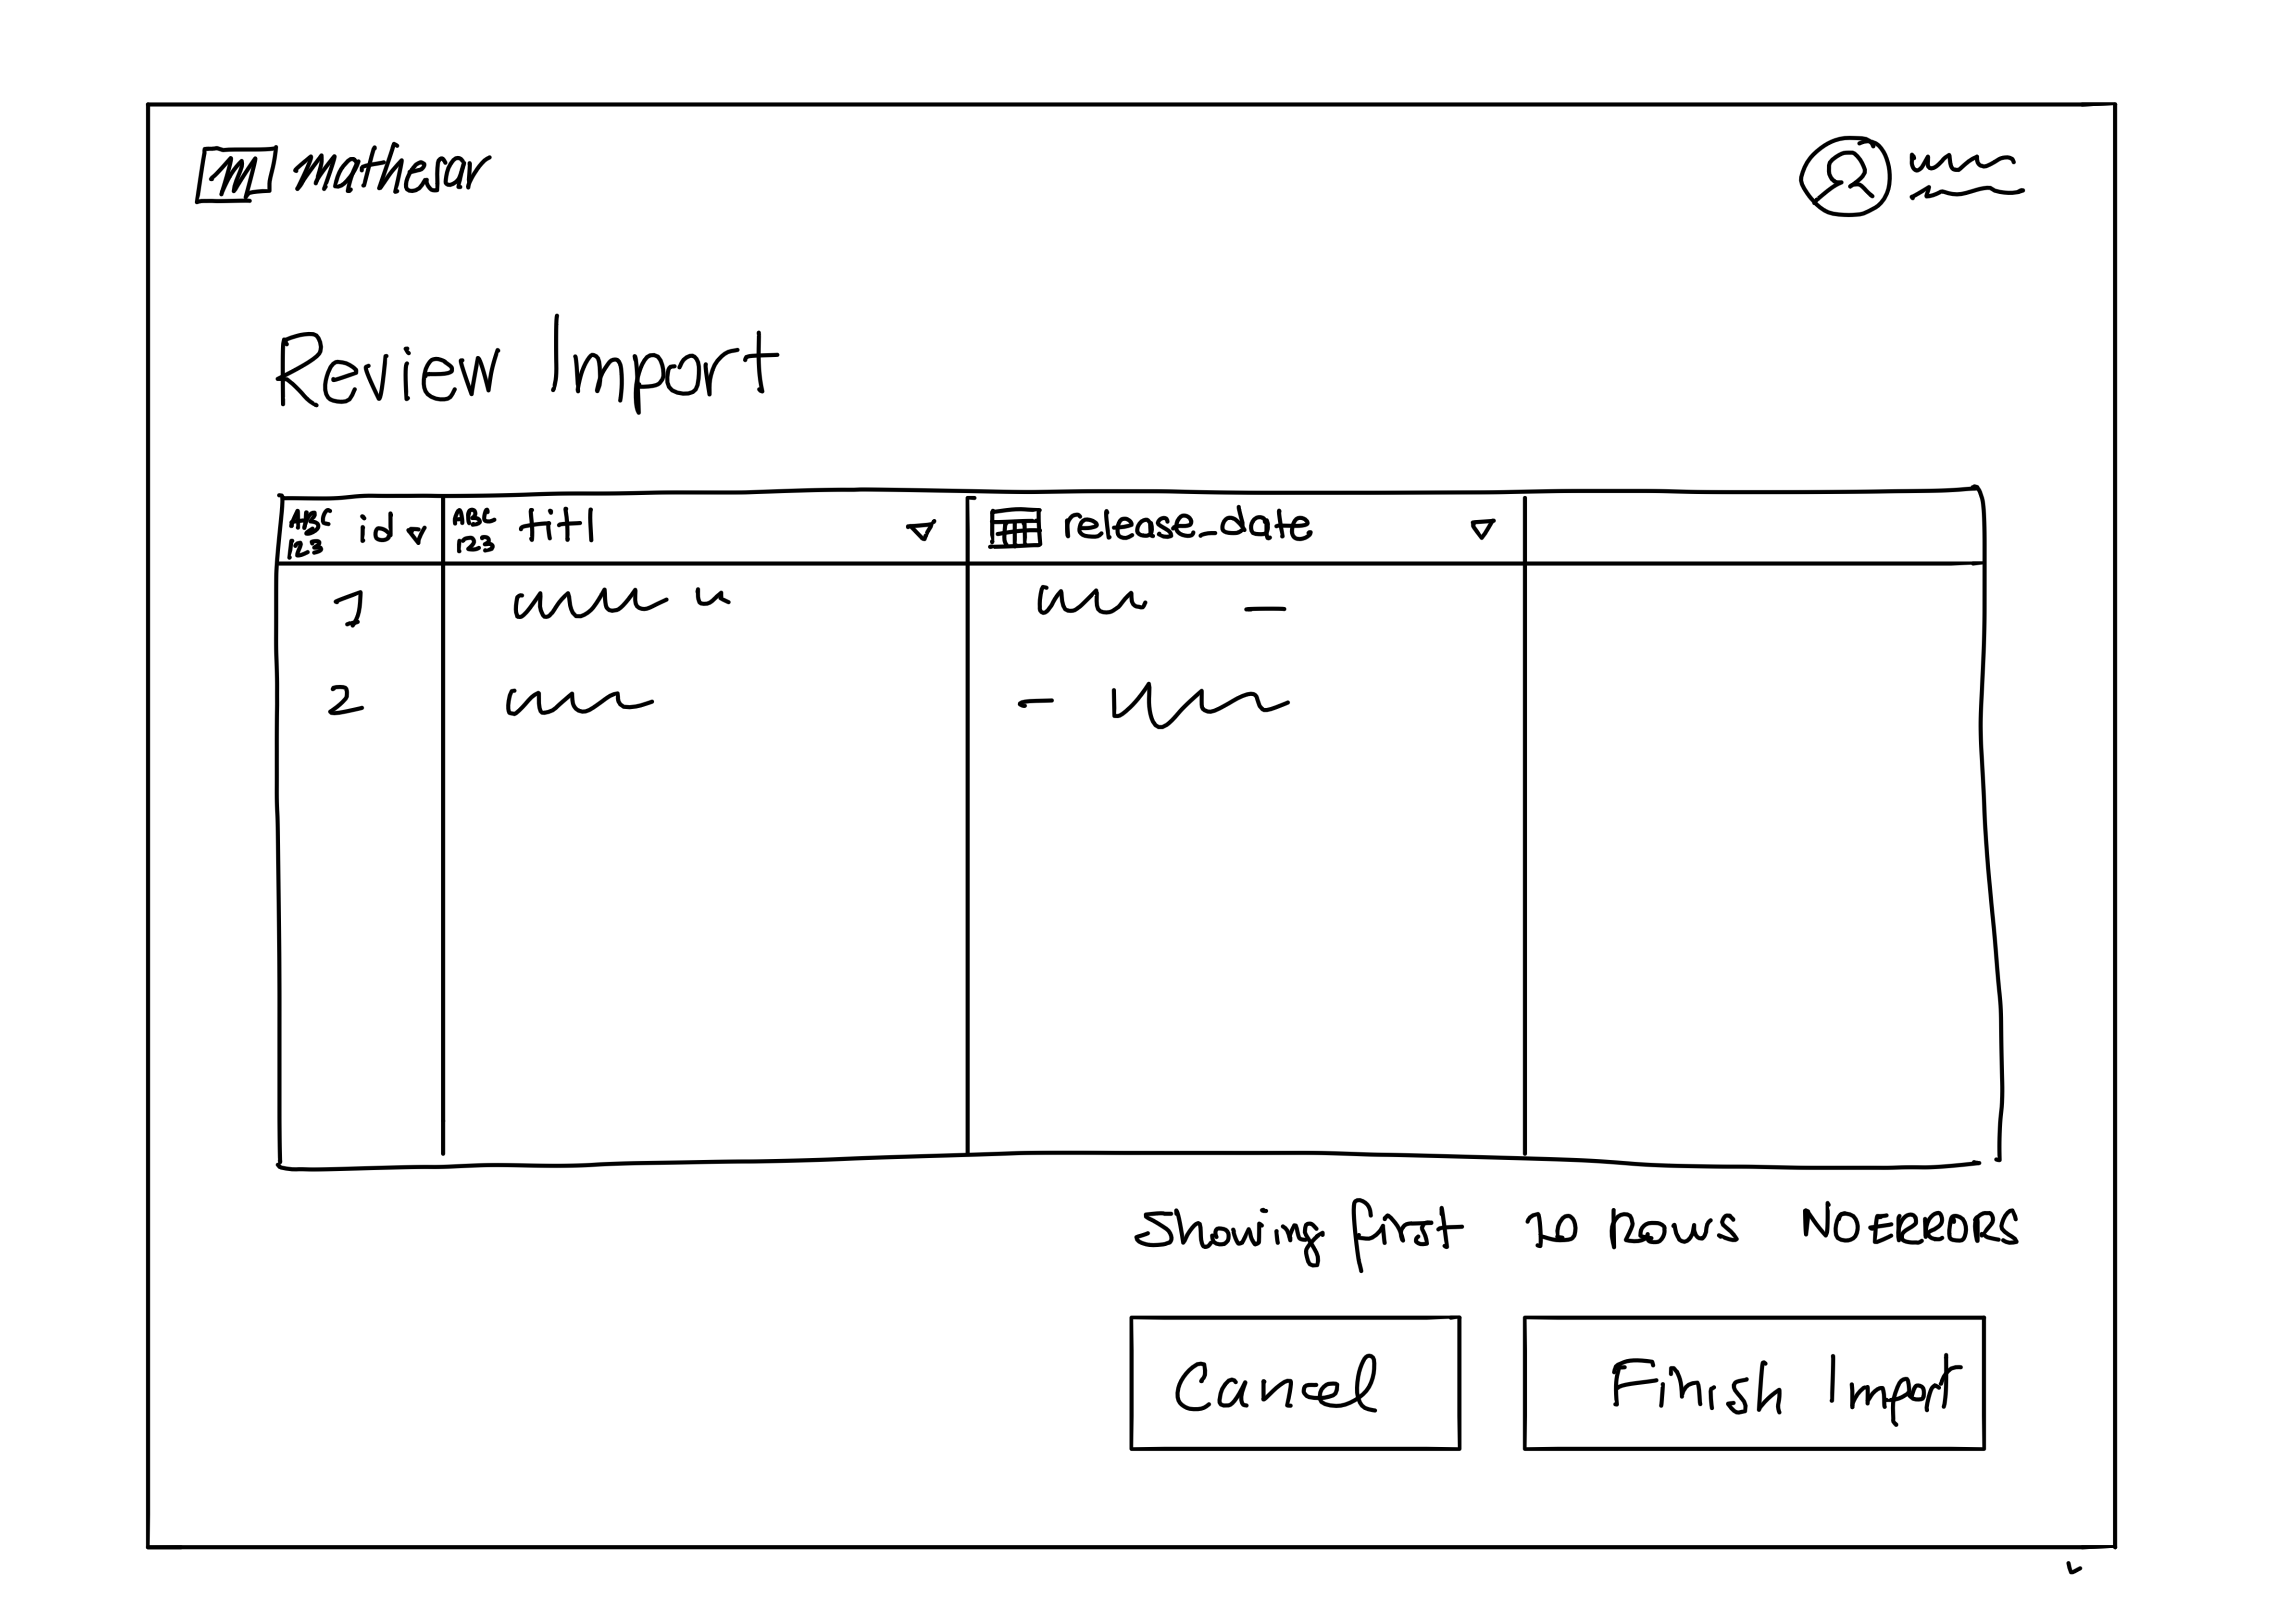
- The user reviews and finishes importing data from the CSV file. The data is added as a new schema table.
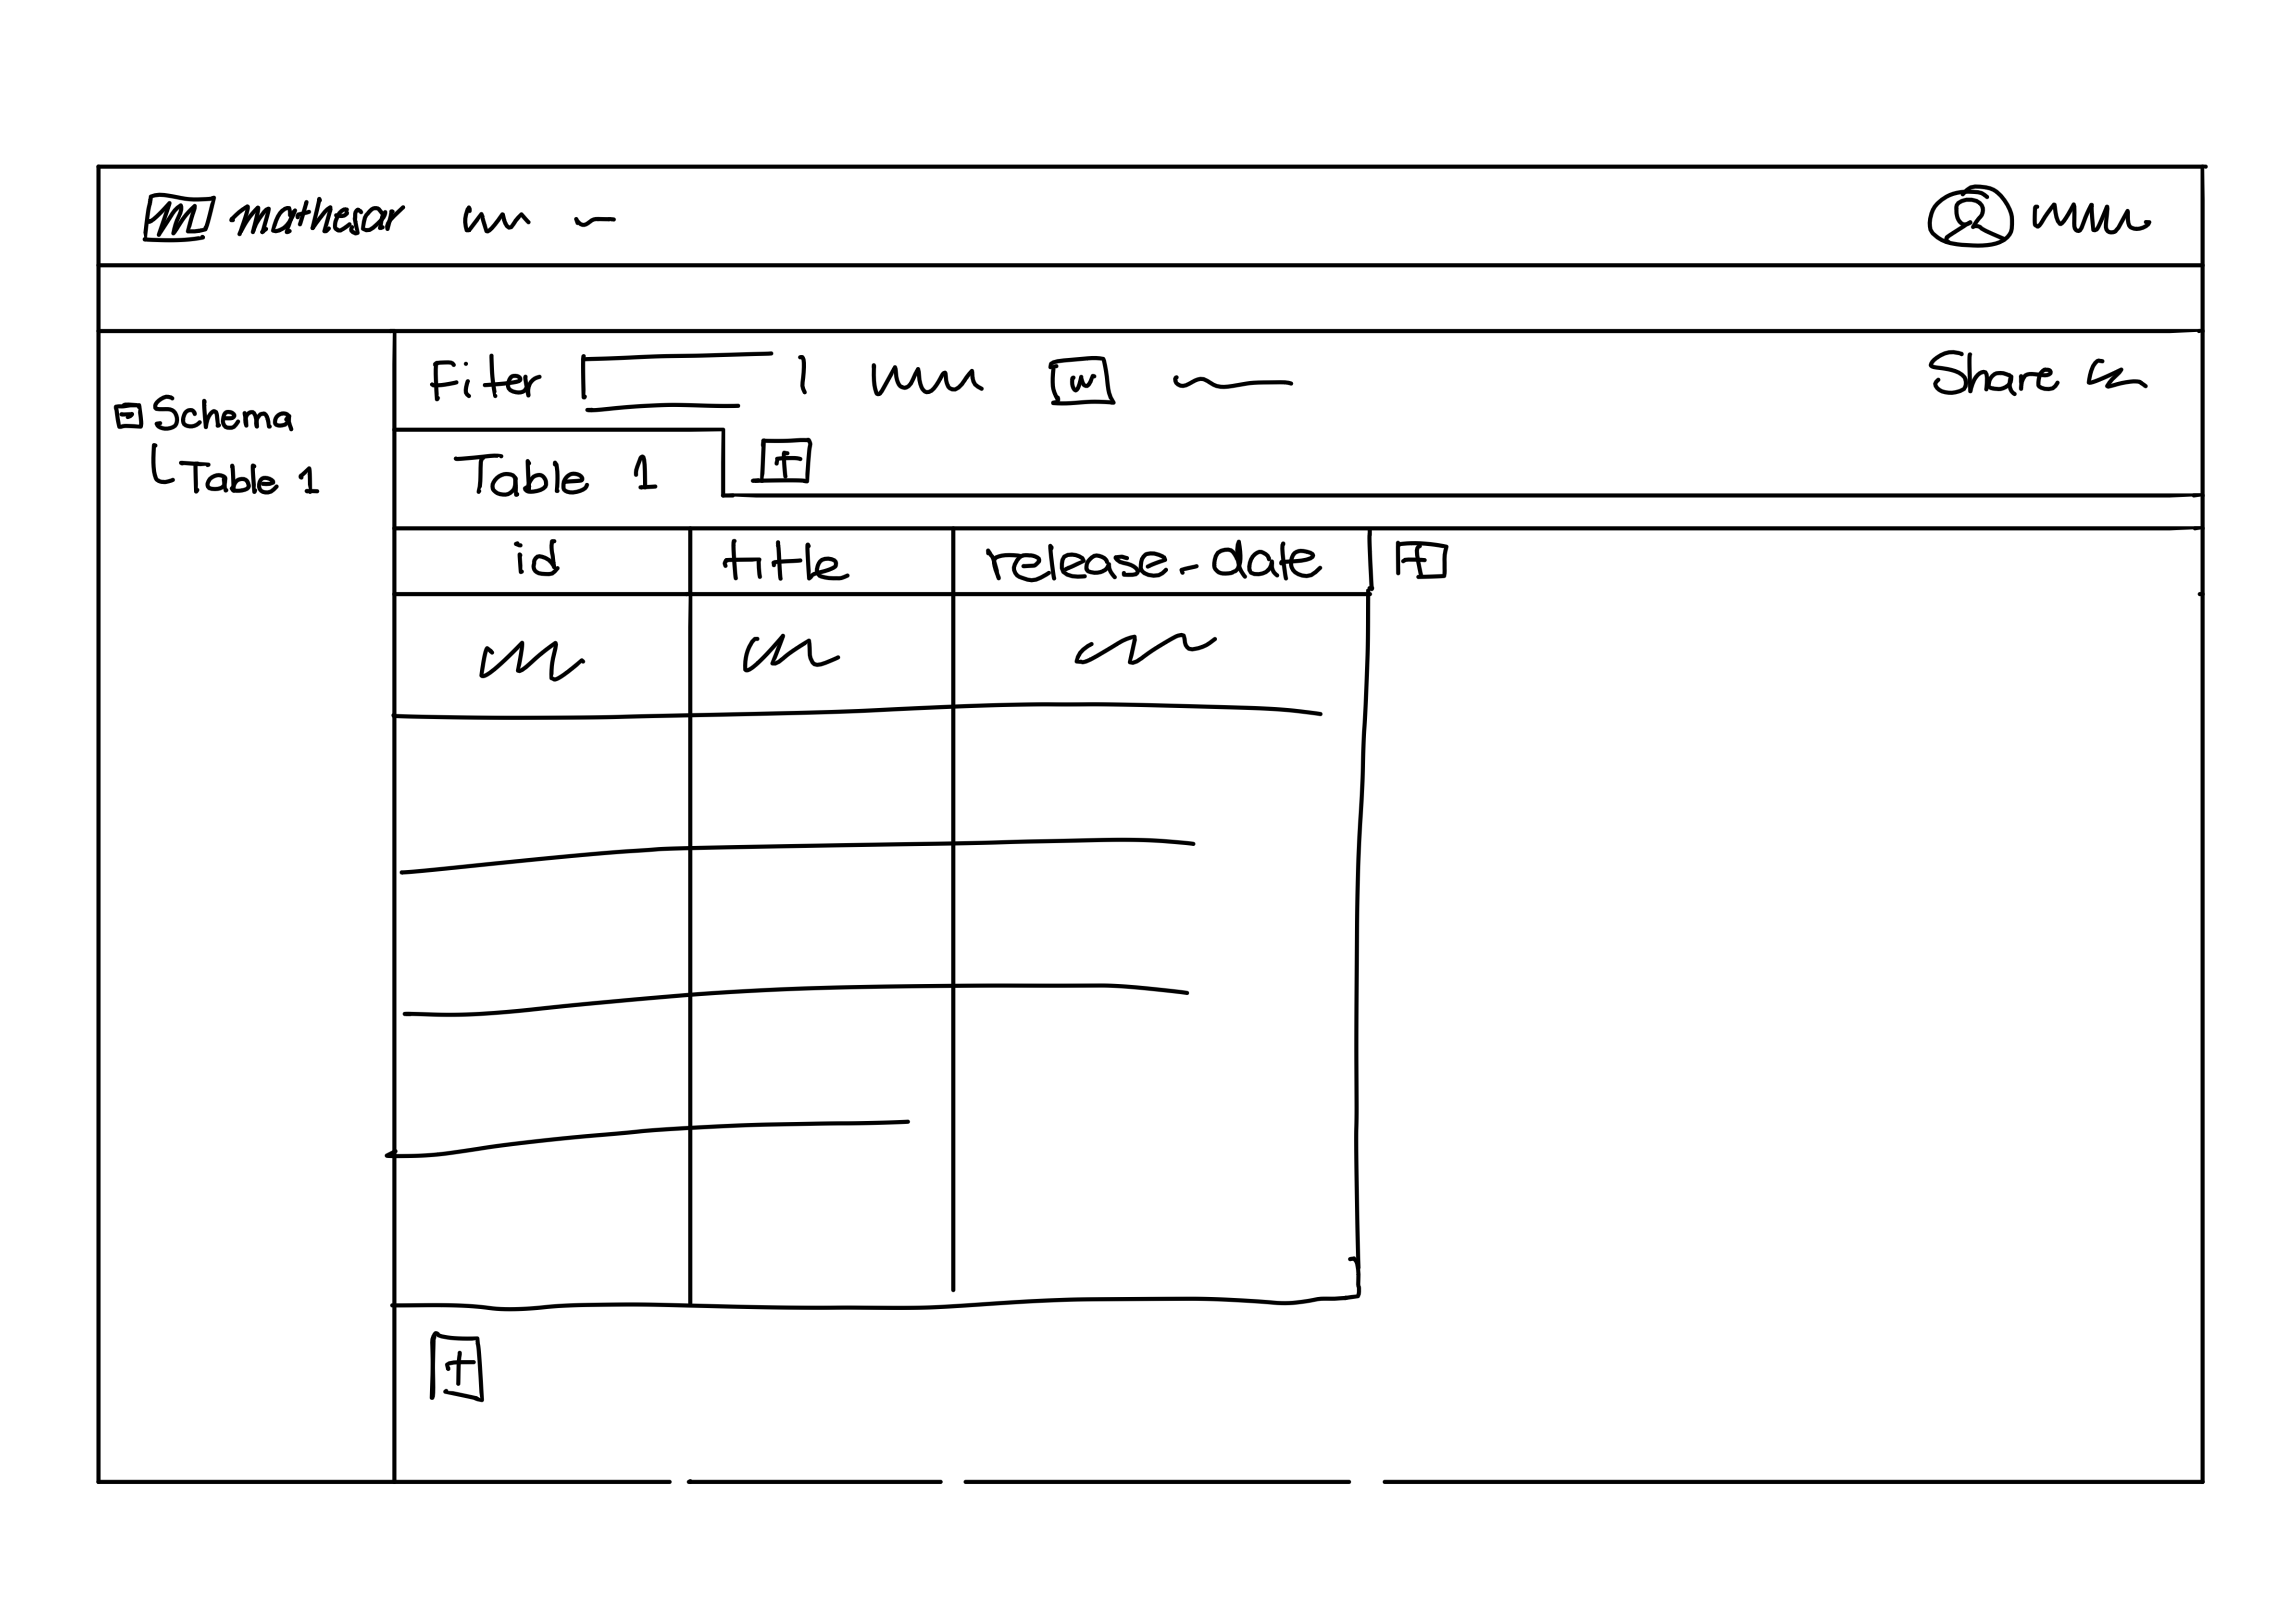
- The user can now explore the data contained on the table, modify its content, sort or filter it.
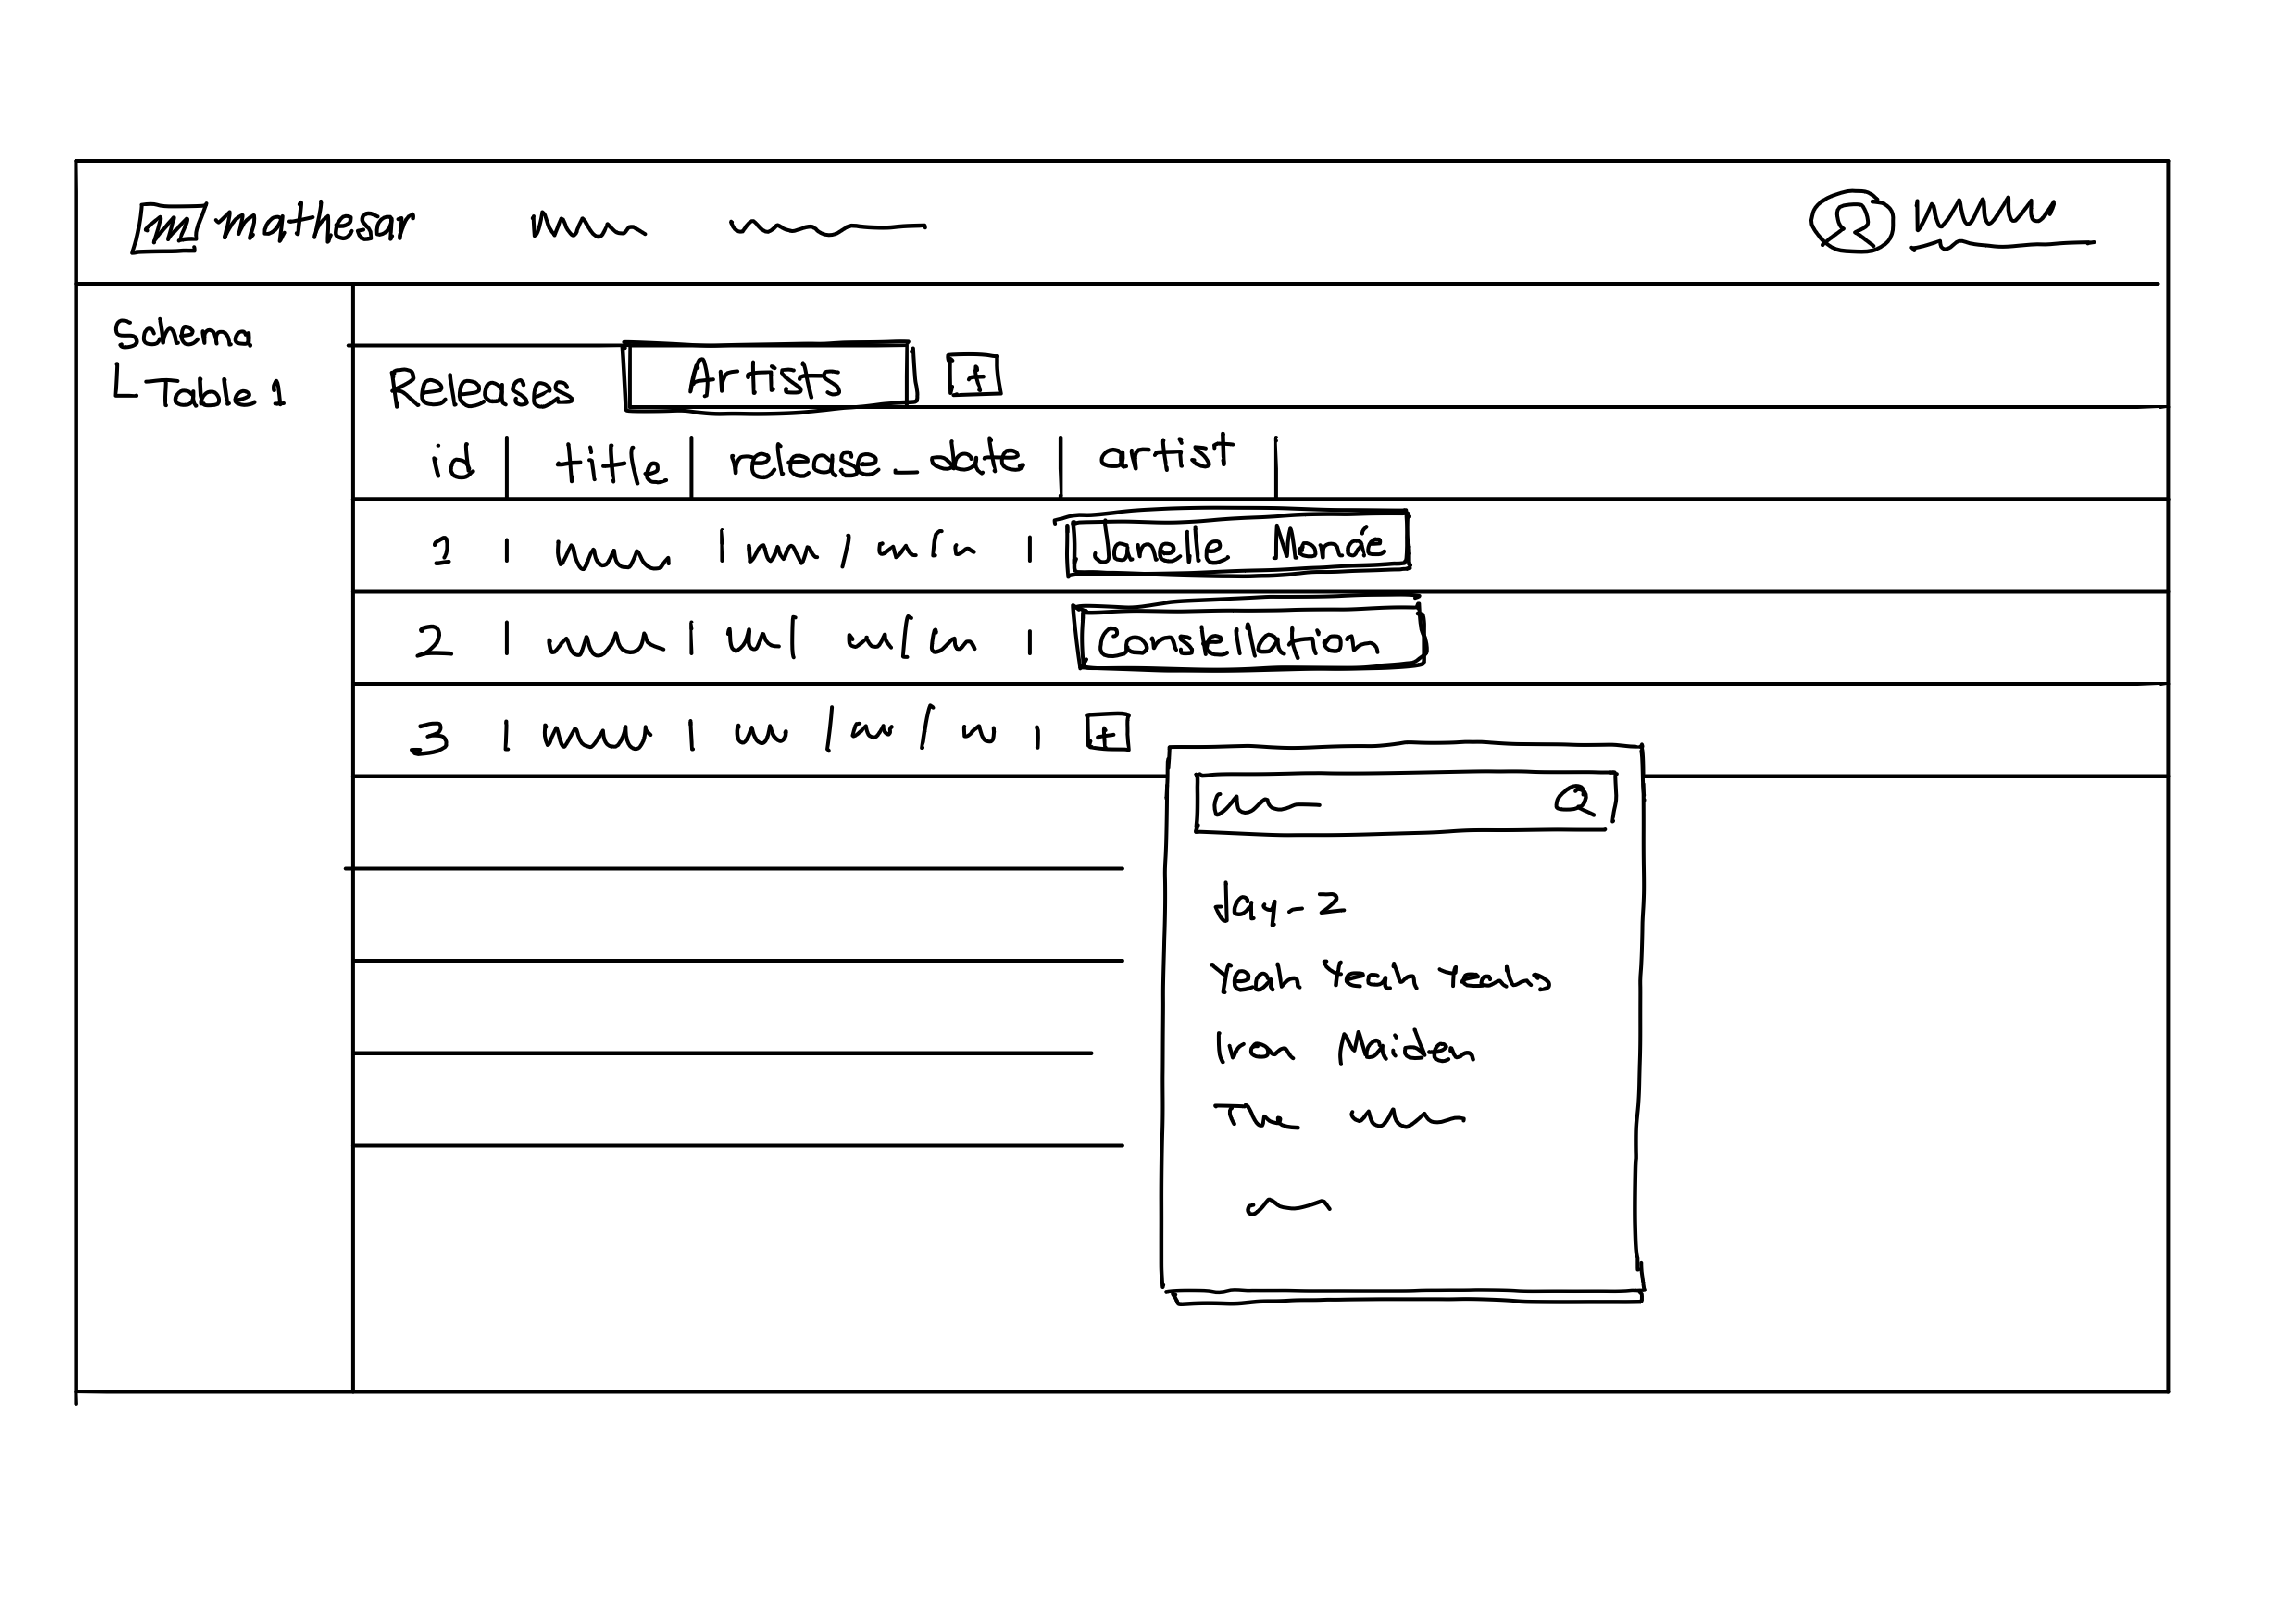
- The user breaks some of the fields into separate tables until satisfied with the data structure.
- The user sets a default view for the table.
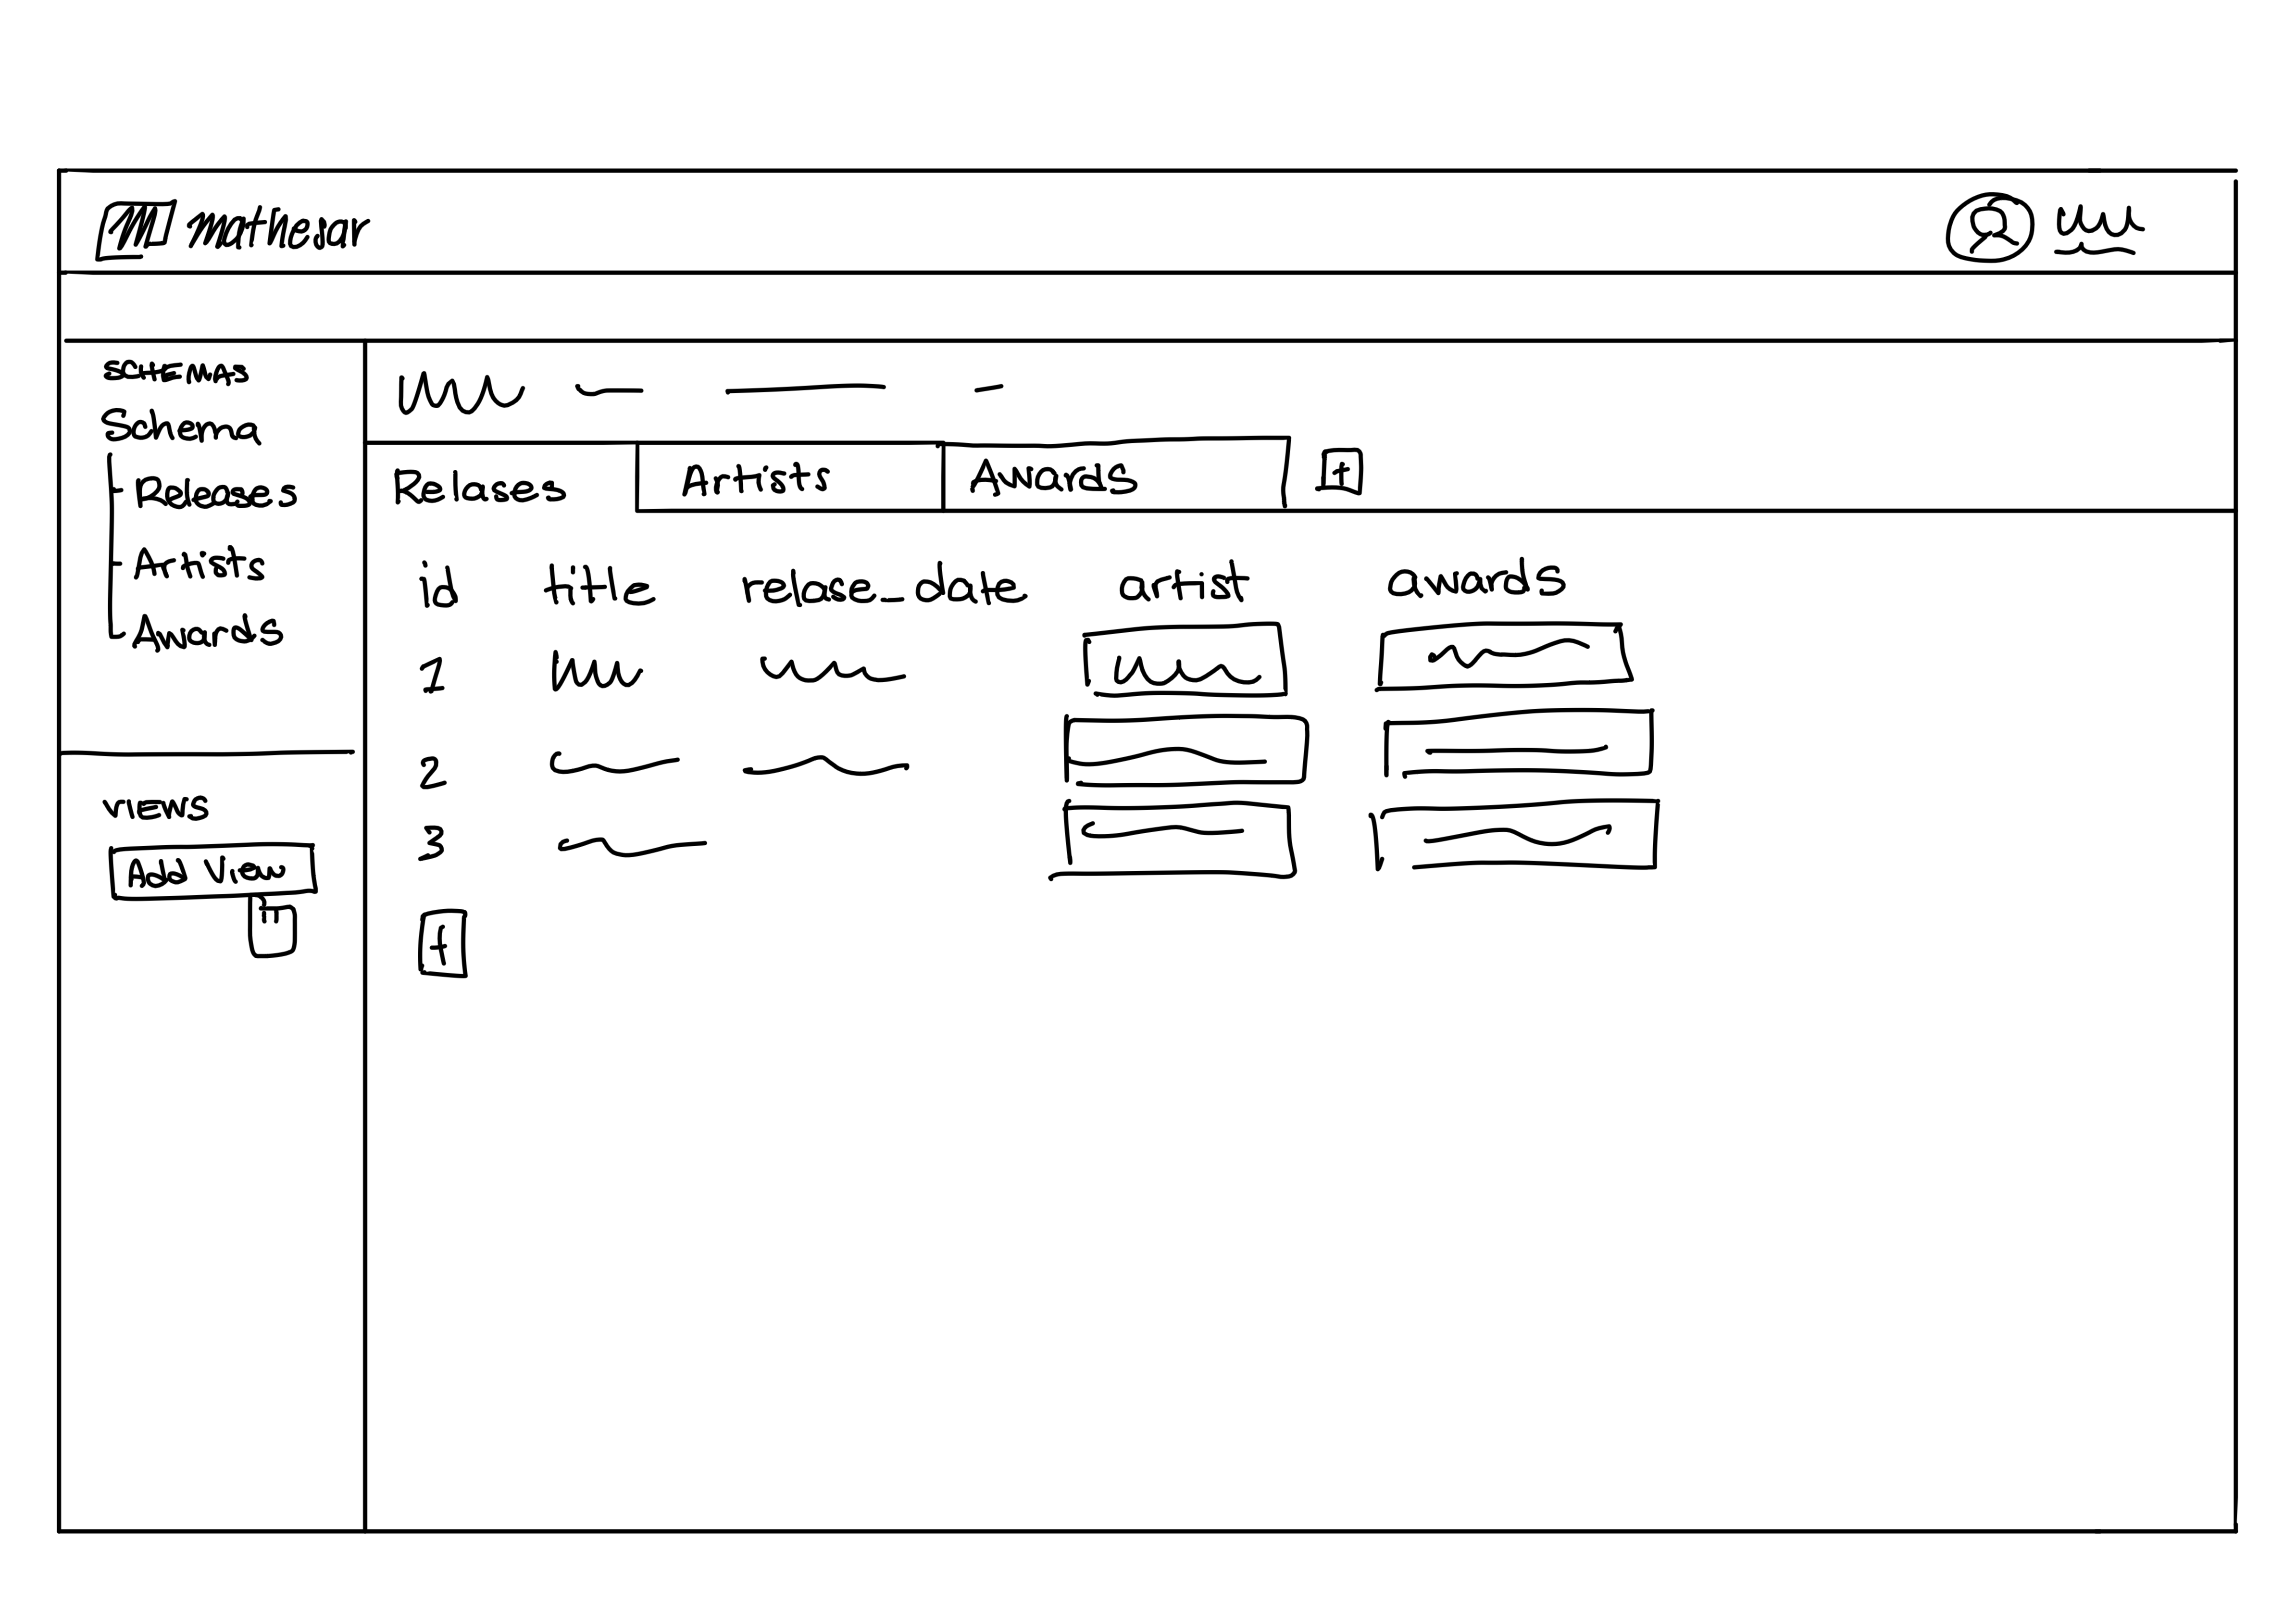
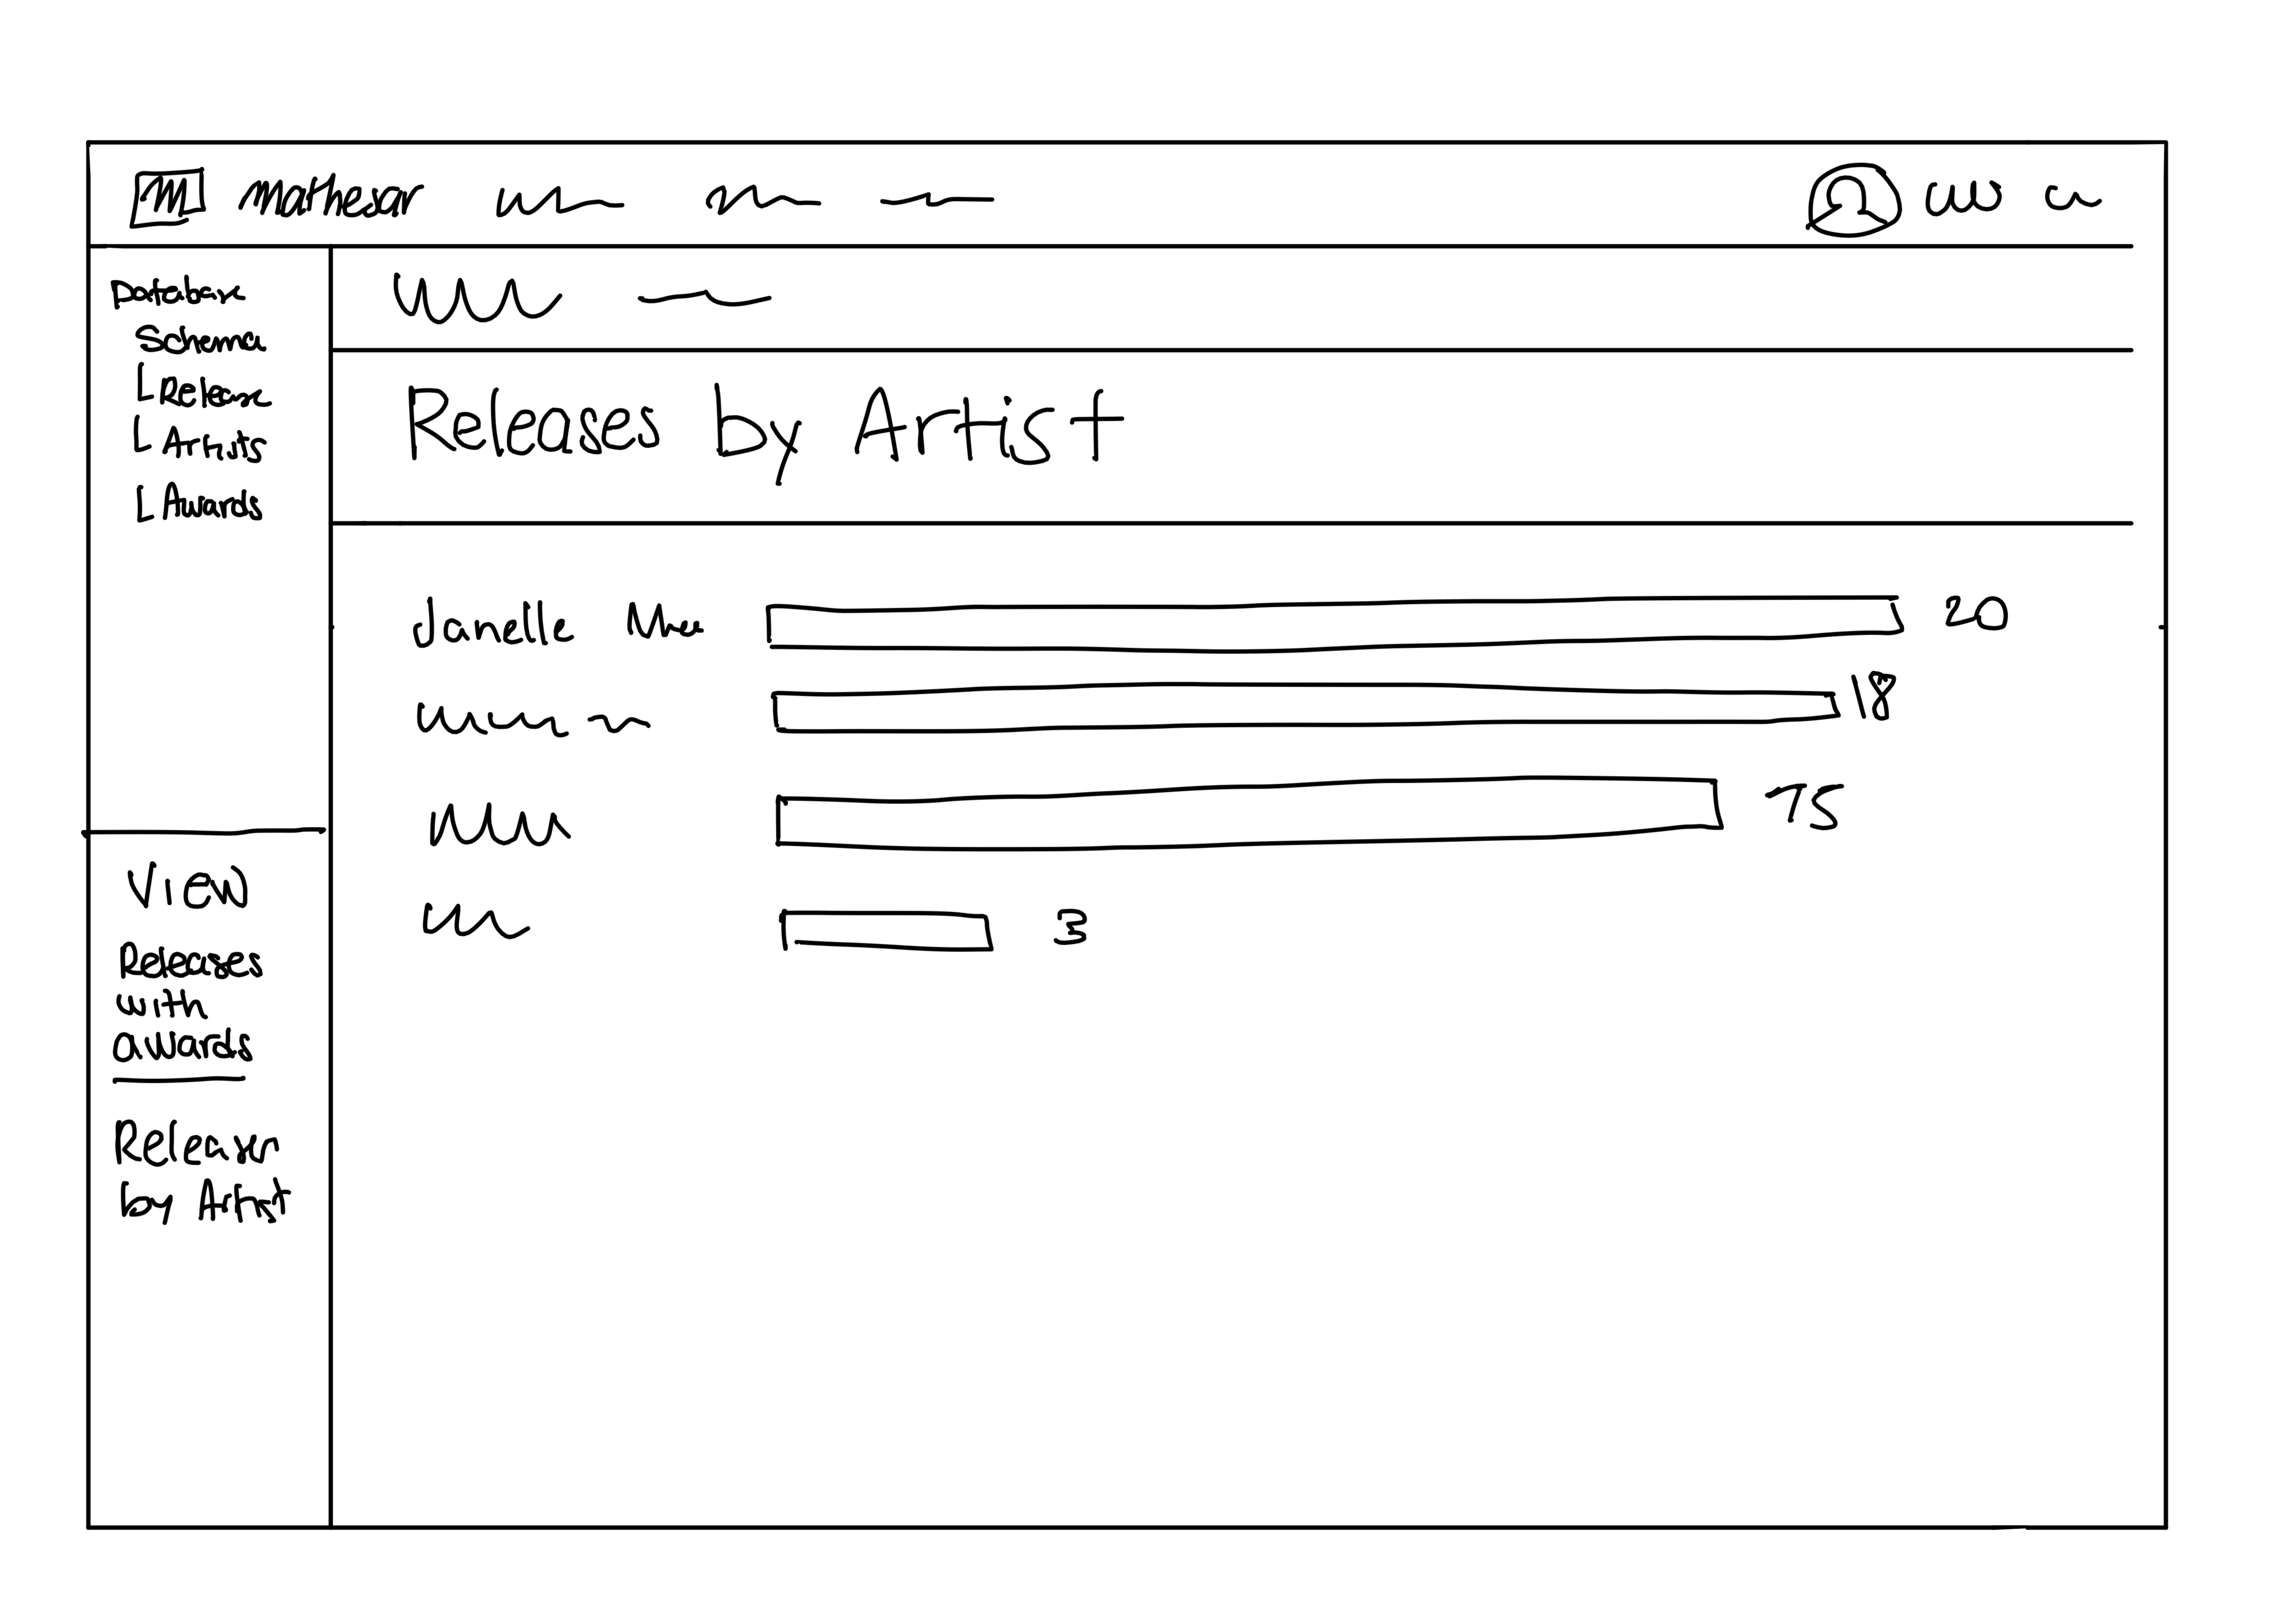
- The user creates an additional chart view by aggregating data